Table of contents
Open Table of contents
Common JVM Command-Line Tools
Obtain the PID of a Java Process
jps -lThis returns the PID of the Java process, which you will use in the commands below.
Inspect the Options of the Current Java Process
-
View the options of the current JVM
jinfo -flags pid -
View the value of a specific option
# View the initial heap size of the current Java process
jinfo -flag InitialHeapSize pid
# Check whether the current Java process uses the UseG1GC garbage collector jinfo -flag UseG1GC pid -
Change JVM options dynamically: enable or disable Boolean options, or assign a value to an option
# Enable GC logging; use +/- to enable or disable Boolean options jinfo -flag +PrintGCDetails # Set the thread stack size to 512k; use option=value for value-based options jinfo -flag ThreadStackSize=512k -
View information about the current heap
jmap -heap pid
Graphical Tools Included with the JDK
-
Common tools include jvisualvm and jconsole. I recommend jvisualvm. Enter the following directly in a terminal:
jvisualvm
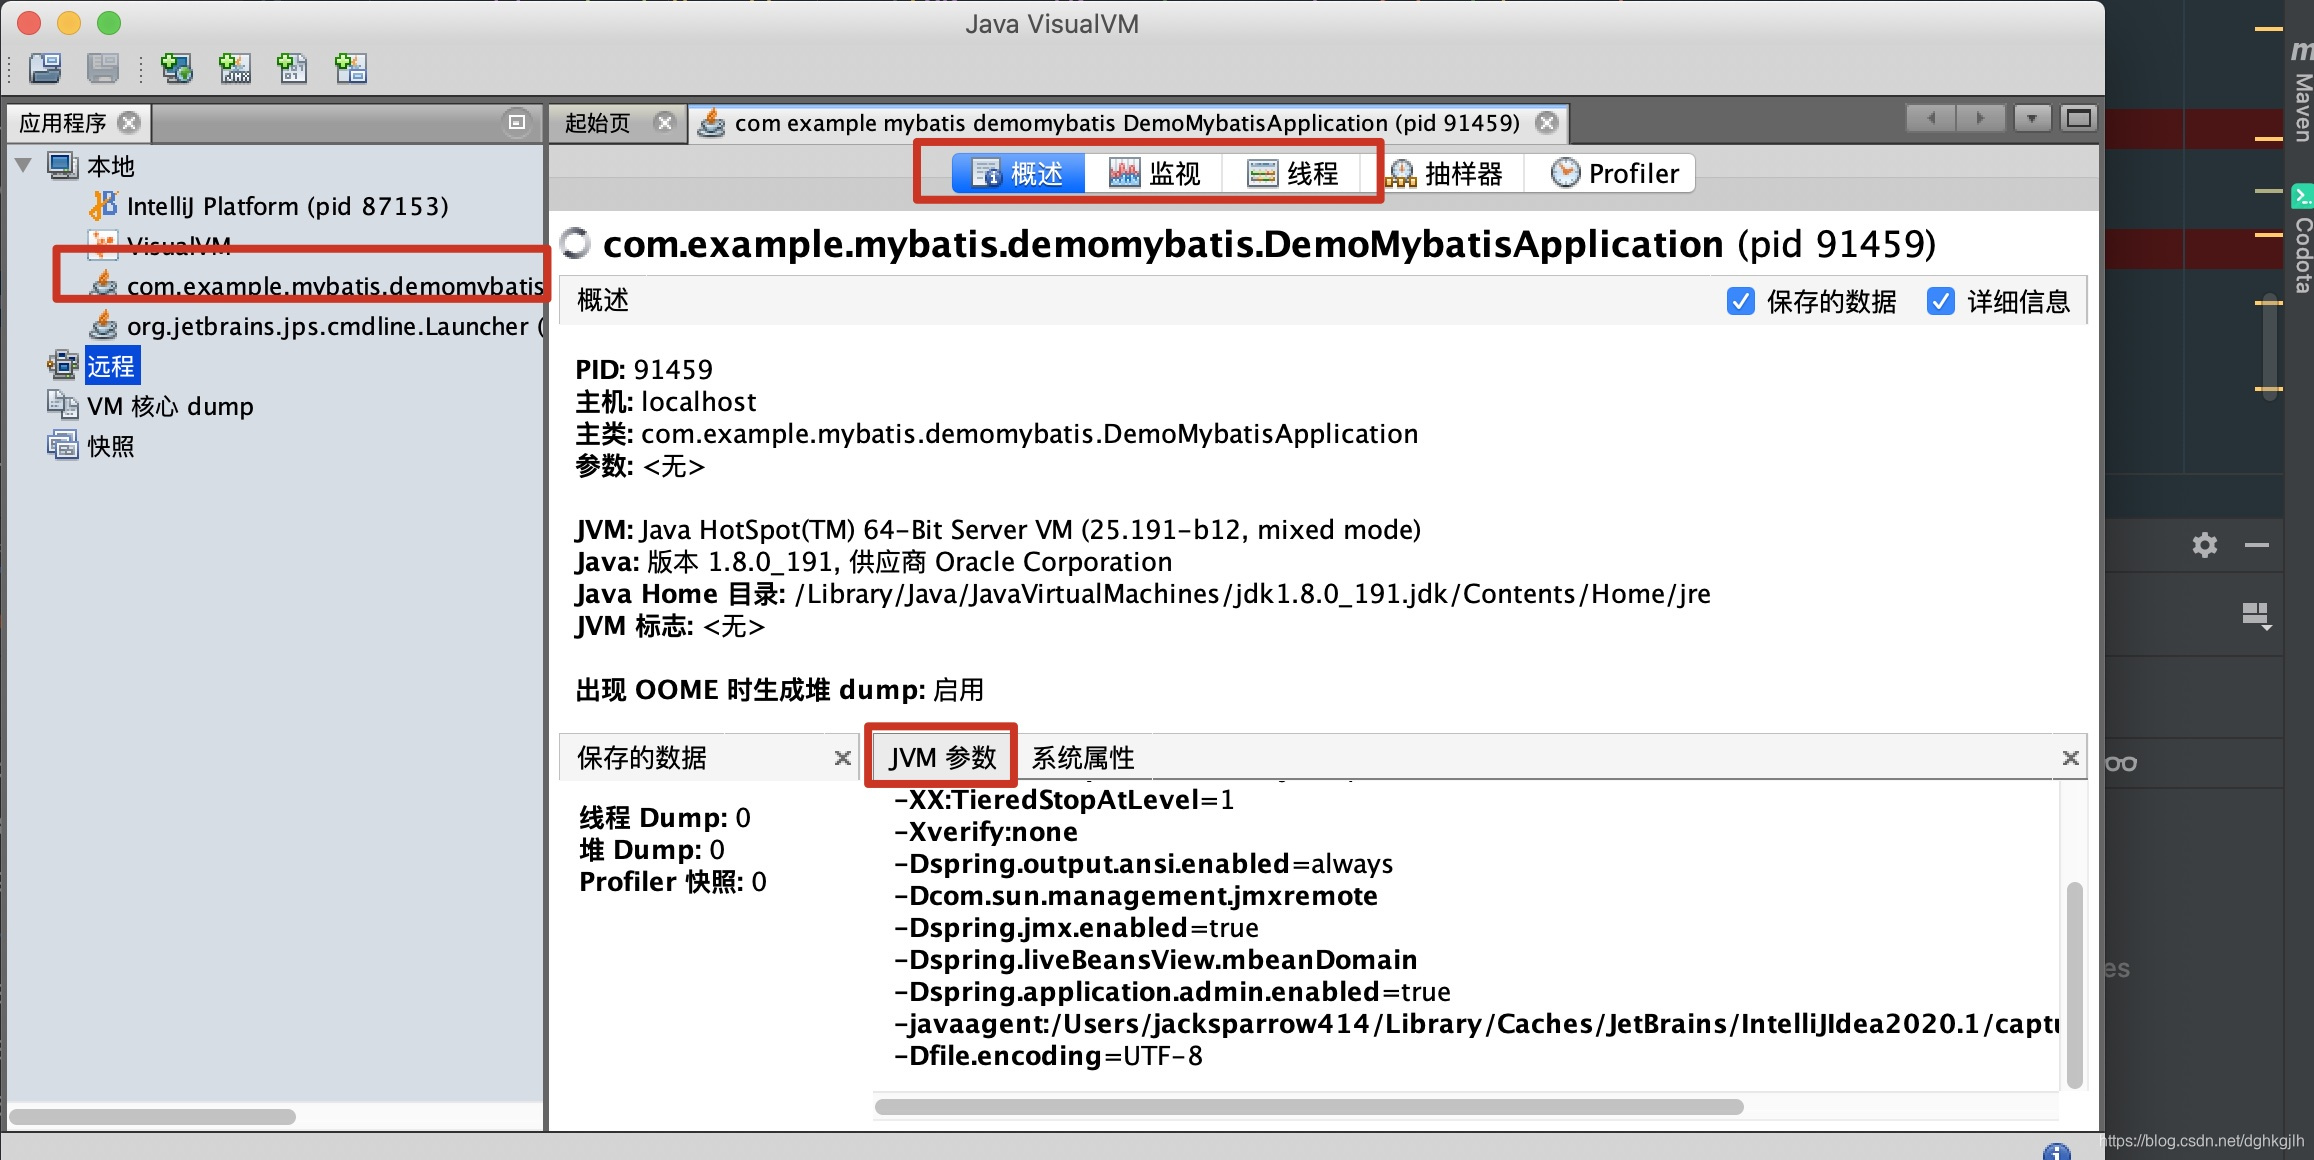
You can connect to a local or remote JVM.
You can see which options are in effect for the current JVM.