Table of contents
Open Table of contents
Getting Started with SkyWalking
Background
In production, with tens or even hundreds or thousands of microservice instances, a failed instance can cause significant losses if we cannot locate it quickly and issue an alert. We therefore need monitoring and alerts for microservices, and monitoring of their call chains to identify problems quickly.
Install and Start Elasticsearch
- Installation commands below are for macOS. On Linux, you can use yum; on Windows, download the appropriate package from the Elasticsearch website.
brew update
brew search elasticsearch
brew install elasticsearch
- Start Elasticsearch.
brew service start elasticsearch-full- Check whether startup succeeded.
Visit localhost:9200 and check for a response similar to this:
{
  "name": "******",
  "cluster_name": "elasticsearch_name",
  "cluster_uuid": "rp73VaY8RRCgQrl4M5uR9A",
  "version": {
    "number": "7.7.1",
    "build_flavor": "default",
    "build_type": "tar",
    "build_hash": "ad56dce891c901a492bb1ee393f12dfff473a423",
    "build_date": "2020-05-28T16:30:01.040088Z",
    "build_snapshot": false,
    "lucene_version": "8.5.1",
    "minimum_wire_compatibility_version": "6.8.0",
    "minimum_index_compatibility_version": "6.0.0-beta1"
  },
  "tagline": "You Know, for Search"
}
If there is no response, inspect the error in the logs. If you do not know the log location, check path.log in elasticsearch.yml; its value is the log directory.
Install and Start SkyWalking
-
Download the appropriate version from the SkyWalking website. Here we download Binary Distribution for ElasticSearch 7, because Elasticsearch 7 is installed above.
-
Extract and modify the configuration.
2.1 Extract the archive.
tar -zxvf apache-skywalking-apm-es7-7.0.0.tar.gz2.2 Enter the extracted directory and modify /config/application.yml.
# Licensed to the Apache Software Foundation (ASF) under one
# or more contributor license agreements.  See the NOTICE file
# distributed with this work for additional information
# regarding copyright ownership.  The ASF licenses this file
# to you under the Apache License, Version 2.0 (the
# "License"); you may not use this file except in compliance
# with the License.  You may obtain a copy of the License at
#
#     http://www.apache.org/licenses/LICENSE-2.0
#
# Unless required by applicable law or agreed to in writing, software
# distributed under the License is distributed on an "AS IS" BASIS,
# WITHOUT WARRANTIES OR CONDITIONS OF ANY KIND, either express or implied.
# See the License for the specific language governing permissions and
# limitations under the License.

# Cluster: this local setup is standalone; remove the unused cluster configuration
cluster:
  selector: ${SW_CLUSTER:standalone}
  standalone:

core:
  selector: ${SW_CORE:default}
  default:
    # Mixed: Receive agent data, Level 1 aggregate, Level 2 aggregate
    # Receiver: Receive agent data, Level 1 aggregate
    # Aggregator: Level 2 aggregate
    role: ${SW_CORE_ROLE:Mixed} # Mixed/Receiver/Aggregator
    restHost: ${SW_CORE_REST_HOST:0.0.0.0}
    restPort: ${SW_CORE_REST_PORT:12800}
    restContextPath: ${SW_CORE_REST_CONTEXT_PATH:/}
    gRPCHost: ${SW_CORE_GRPC_HOST:0.0.0.0}
    gRPCPort: ${SW_CORE_GRPC_PORT:11800}
    gRPCSslEnabled: ${SW_CORE_GRPC_SSL_ENABLED:false}
    gRPCSslKeyPath: ${SW_CORE_GRPC_SSL_KEY_PATH:""}
    gRPCSslCertChainPath: ${SW_CORE_GRPC_SSL_CERT_CHAIN_PATH:""}
    gRPCSslTrustedCAPath: ${SW_CORE_GRPC_SSL_TRUSTED_CA_PATH:""}
    downsampling:
      - Hour
      - Day
      - Month
    # Set a timeout on metrics data. After the timeout has expired, the metrics data will automatically be deleted.
    enableDataKeeperExecutor: ${SW_CORE_ENABLE_DATA_KEEPER_EXECUTOR:true} # Turn it off then automatically metrics data delete will be close.
    dataKeeperExecutePeriod: ${SW_CORE_DATA_KEEPER_EXECUTE_PERIOD:5} # How often the data keeper executor runs periodically, unit is minute
    recordDataTTL: ${SW_CORE_RECORD_DATA_TTL:90} # Unit is minute
    minuteMetricsDataTTL: ${SW_CORE_MINUTE_METRIC_DATA_TTL:90} # Unit is minute
    hourMetricsDataTTL: ${SW_CORE_HOUR_METRIC_DATA_TTL:36} # Unit is hour
    dayMetricsDataTTL: ${SW_CORE_DAY_METRIC_DATA_TTL:45} # Unit is day
    monthMetricsDataTTL: ${SW_CORE_MONTH_METRIC_DATA_TTL:18} # Unit is month
    # Cache metric data for 1 minute to reduce database queries, and if the OAP cluster changes within that minute,
    # the metrics may not be accurate within that minute.
    enableDatabaseSession: ${SW_CORE_ENABLE_DATABASE_SESSION:true}
    topNReportPeriod: ${SW_CORE_TOPN_REPORT_PERIOD:10} # top_n record worker report cycle, unit is minute
    # Extra model column are the column defined by in the codes, These columns of model are not required logically in aggregation or further query,
    # and it will cause more load for memory, network of OAP and storage.
    # But, being activated, user could see the name in the storage entities, which make users easier to use 3rd party tool, such as Kibana->ES, to query the data by themselves.
    activeExtraModelColumns: ${SW_CORE_ACTIVE_EXTRA_MODEL_COLUMNS:false}

storage:
  selector: ${SW_STORAGE:elasticsearch7}
  elasticsearch7:
    nameSpace: ${SW_NAMESPACE:"elasticsearch7"}
    clusterNodes: ${SW_STORAGE_ES_CLUSTER_NODES:localhost:9200}
    protocol: ${SW_STORAGE_ES_HTTP_PROTOCOL:"http"}
    # trustStorePath: ${SW_SW_STORAGE_ES_SSL_JKS_PATH:"../es_keystore.jks"}
    # trustStorePass: ${SW_SW_STORAGE_ES_SSL_JKS_PASS:""}
    enablePackedDownsampling: ${SW_STORAGE_ENABLE_PACKED_DOWNSAMPLING:true} # Hour and Day metrics will be merged into minute index.
    dayStep: ${SW_STORAGE_DAY_STEP:1} # Represent the number of days in the one minute/hour/day index.
    user: ${SW_ES_USER:""}
    password: ${SW_ES_PASSWORD:""}
    secretsManagementFile: ${SW_ES_SECRETS_MANAGEMENT_FILE:""} # Secrets management file in the properties format includes the username, password, which are managed by 3rd party tool.
    indexShardsNumber: ${SW_STORAGE_ES_INDEX_SHARDS_NUMBER:2}
    indexReplicasNumber: ${SW_STORAGE_ES_INDEX_REPLICAS_NUMBER:0}
    # Those data TTL settings will override the same settings in core module.
    recordDataTTL: ${SW_STORAGE_ES_RECORD_DATA_TTL:7} # Unit is day
    otherMetricsDataTTL: ${SW_STORAGE_ES_OTHER_METRIC_DATA_TTL:45} # Unit is day
    monthMetricsDataTTL: ${SW_STORAGE_ES_MONTH_METRIC_DATA_TTL:18} # Unit is month
    # Batch process setting, refer to https://www.elastic.co/guide/en/elasticsearch/client/java-api/5.5/java-docs-bulk-processor.html
    bulkActions: ${SW_STORAGE_ES_BULK_ACTIONS:1000} # Execute the bulk every 1000 requests
    flushInterval: ${SW_STORAGE_ES_FLUSH_INTERVAL:10} # flush the bulk every 10 seconds whatever the number of requests
    concurrentRequests: ${SW_STORAGE_ES_CONCURRENT_REQUESTS:2} # the number of concurrent requests
    resultWindowMaxSize: ${SW_STORAGE_ES_QUERY_MAX_WINDOW_SIZE:10000}
    metadataQueryMaxSize: ${SW_STORAGE_ES_QUERY_MAX_SIZE:5000}
    segmentQueryMaxSize: ${SW_STORAGE_ES_QUERY_SEGMENT_SIZE:200}
    profileTaskQueryMaxSize: ${SW_STORAGE_ES_QUERY_PROFILE_TASK_SIZE:200}
    advanced: ${SW_STORAGE_ES_ADVANCED:""}

receiver-sharing-server:
  selector: ${SW_RECEIVER_SHARING_SERVER:default}
  default:
    authentication: ${SW_AUTHENTICATION:""}
receiver-register:
  selector: ${SW_RECEIVER_REGISTER:default}
  default:

receiver-trace:
  selector: ${SW_RECEIVER_TRACE:default}
  default:
    bufferPath: ${SW_RECEIVER_BUFFER_PATH:../trace-buffer/} # Path to trace buffer files, suggest to use absolute path
    bufferOffsetMaxFileSize: ${SW_RECEIVER_BUFFER_OFFSET_MAX_FILE_SIZE:100} # Unit is MB
    bufferDataMaxFileSize: ${SW_RECEIVER_BUFFER_DATA_MAX_FILE_SIZE:500} # Unit is MB
    bufferFileCleanWhenRestart: ${SW_RECEIVER_BUFFER_FILE_CLEAN_WHEN_RESTART:false}
    sampleRate: ${SW_TRACE_SAMPLE_RATE:10000} # The sample rate precision is 1/10000. 10000 means 100% sample in default.
    slowDBAccessThreshold: ${SW_SLOW_DB_THRESHOLD:default:200,mongodb:100} # The slow database access thresholds. Unit ms.

receiver-jvm:
  selector: ${SW_RECEIVER_JVM:default}
  default:

receiver-clr:
  selector: ${SW_RECEIVER_CLR:default}
  default:

receiver-profile:
  selector: ${SW_RECEIVER_PROFILE:default}
  default:

service-mesh:
  selector: ${SW_SERVICE_MESH:default}
  default:
    bufferPath: ${SW_SERVICE_MESH_BUFFER_PATH:../mesh-buffer/} # Path to trace buffer files, suggest to use absolute path
    bufferOffsetMaxFileSize: ${SW_SERVICE_MESH_OFFSET_MAX_FILE_SIZE:100} # Unit is MB
    bufferDataMaxFileSize: ${SW_SERVICE_MESH_BUFFER_DATA_MAX_FILE_SIZE:500} # Unit is MB
    bufferFileCleanWhenRestart: ${SW_SERVICE_MESH_BUFFER_FILE_CLEAN_WHEN_RESTART:false}

istio-telemetry:
  selector: ${SW_ISTIO_TELEMETRY:default}
  default:

envoy-metric:
  selector: ${SW_ENVOY_METRIC:default}
  default:
    alsHTTPAnalysis: ${SW_ENVOY_METRIC_ALS_HTTP_ANALYSIS:""}

receiver_zipkin:
  selector: ${SW_RECEIVER_ZIPKIN:-}
  default:
    host: ${SW_RECEIVER_ZIPKIN_HOST:0.0.0.0}
    port: ${SW_RECEIVER_ZIPKIN_PORT:9411}
    contextPath: ${SW_RECEIVER_ZIPKIN_CONTEXT_PATH:/}

receiver_jaeger:
  selector: ${SW_RECEIVER_JAEGER:-}
  default:
    gRPCHost: ${SW_RECEIVER_JAEGER_HOST:0.0.0.0}
    gRPCPort: ${SW_RECEIVER_JAEGER_PORT:14250}

query:
  selector: ${SW_QUERY:graphql}
  graphql:
    path: ${SW_QUERY_GRAPHQL_PATH:/graphql}

alarm:
  selector: ${SW_ALARM:default}
  default:

telemetry:
  selector: ${SW_TELEMETRY:none}
  none:
  prometheus:
    host: ${SW_TELEMETRY_PROMETHEUS_HOST:0.0.0.0}
    port: ${SW_TELEMETRY_PROMETHEUS_PORT:1234}
  so11y:
    prometheusExporterEnabled: ${SW_TELEMETRY_SO11Y_PROMETHEUS_ENABLED:true}
    prometheusExporterHost: ${SW_TELEMETRY_PROMETHEUS_HOST:0.0.0.0}
    prometheusExporterPort: ${SW_TELEMETRY_PROMETHEUS_PORT:1234}

receiver-so11y:
  selector: ${SW_RECEIVER_SO11Y:-}
  default:
  # No configuration center is used here; remove unnecessary configuration
configuration:
  selector: ${SW_CONFIGURATION:none}
  none:

exporter:
  selector: ${SW_EXPORTER:-}
  grpc:
    targetHost: ${SW_EXPORTER_GRPC_HOST:127.0.0.1}
    targetPort: ${SW_EXPORTER_GRPC_PORT:9870}
Configuration explanation:
cluster: several registries are available; the default is standalone.
core: use the defaults.
storage: stores trace data for queries and display. H2, MySQL, Elasticsearch, and InfluxDB are supported. recordDataTTL specifies retention duration; the default is seven days.
Here we choose es7 and comment out the other storage options. Select elasticsearch7 in the storage selector. Other unnecessary settings have been removed. For clusters, configuration centers, or storage such as H2 and MySQL, add the relevant official configuration.
-
Start OAP and SkyWalking UI.
cd bin
# Start OAP
oapService.sh
# Start SkyWalking UI
webappService.sh
Visit localhost:8080. What if port 8080 is occupied? Modify port in webaap.yml under webapp. After startup, the page looks like this:
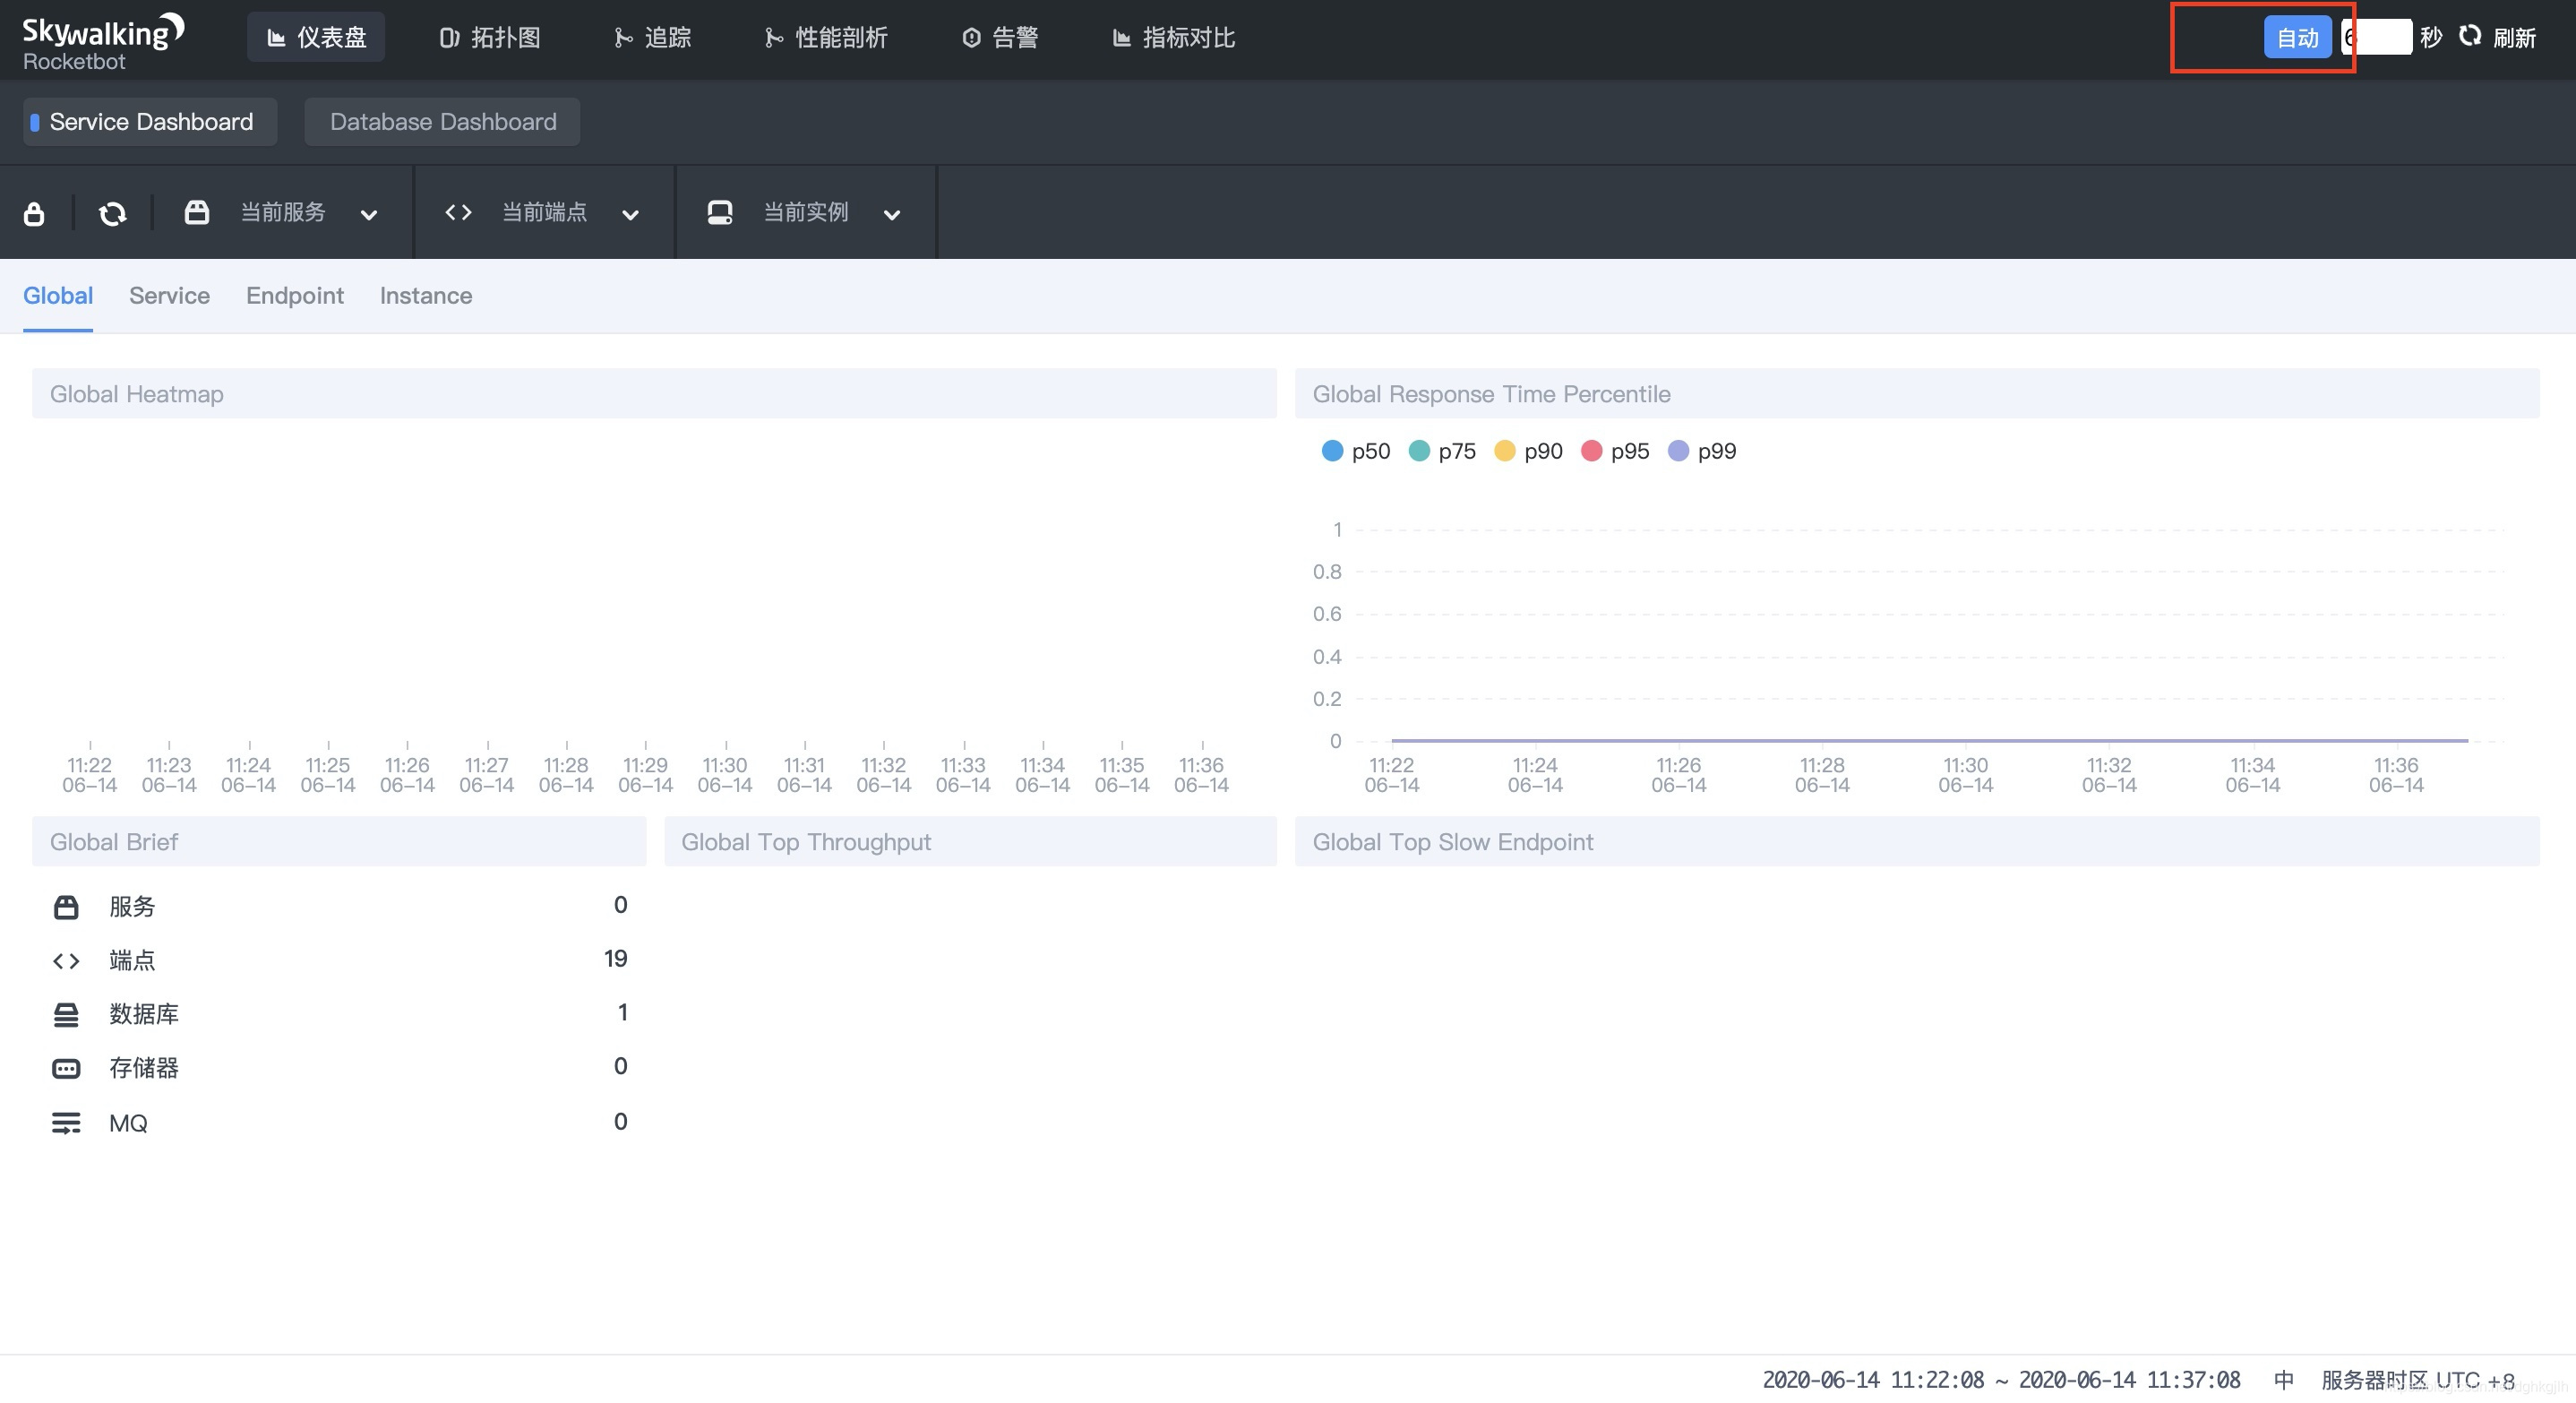
Enable the automatic-refresh button and configure the start time for filtering below. SkyWalking then refreshes collected data every six seconds.
Configure Agents for Spring Cloud Microservices
-
Using Eureka as the registry, configure the agents as follows.
1.1 Add the following to VM options in IDEA Run/Debug Configurations:
# After -javaagent, specify the path to skywalking-agent.jar
-javaagent:/Users/jacksparrow414/skywalking/apache-skywalking-apm-bin-es7/agent/skywalking-agent.jar
1.2 Add two settings under Environment variables:
SW_AGENT_NAME=eureka;SW_AGENT_COLLECTOR_BACKEND_SERVICES=127.0.0.1:11800SW_AGENT_NAME is the service name and can be chosen freely. Different instances of the same service use the same name.
1.3 Configure gateway, one-service (two instances: DemoClientone and DemoClientthree), and two-service similarly. Both service 1 and service 2 connect to the local database on port 3306. There are five applications. Start them in this order:
Registry -> gateway -> service 1 (two instances) -> service 2
Then start nginx.
Why start nginx?
The actual request path is: Web browser/App/H5 Mini Program -> request -> nginx reverse proxy -> forward to gateway -> gateway examines API path -> route to a microservice instance
1.4 To check whether the agent is active, look for this output first when each application starts:
1.5 After a short wait, SkyWalking UI shows: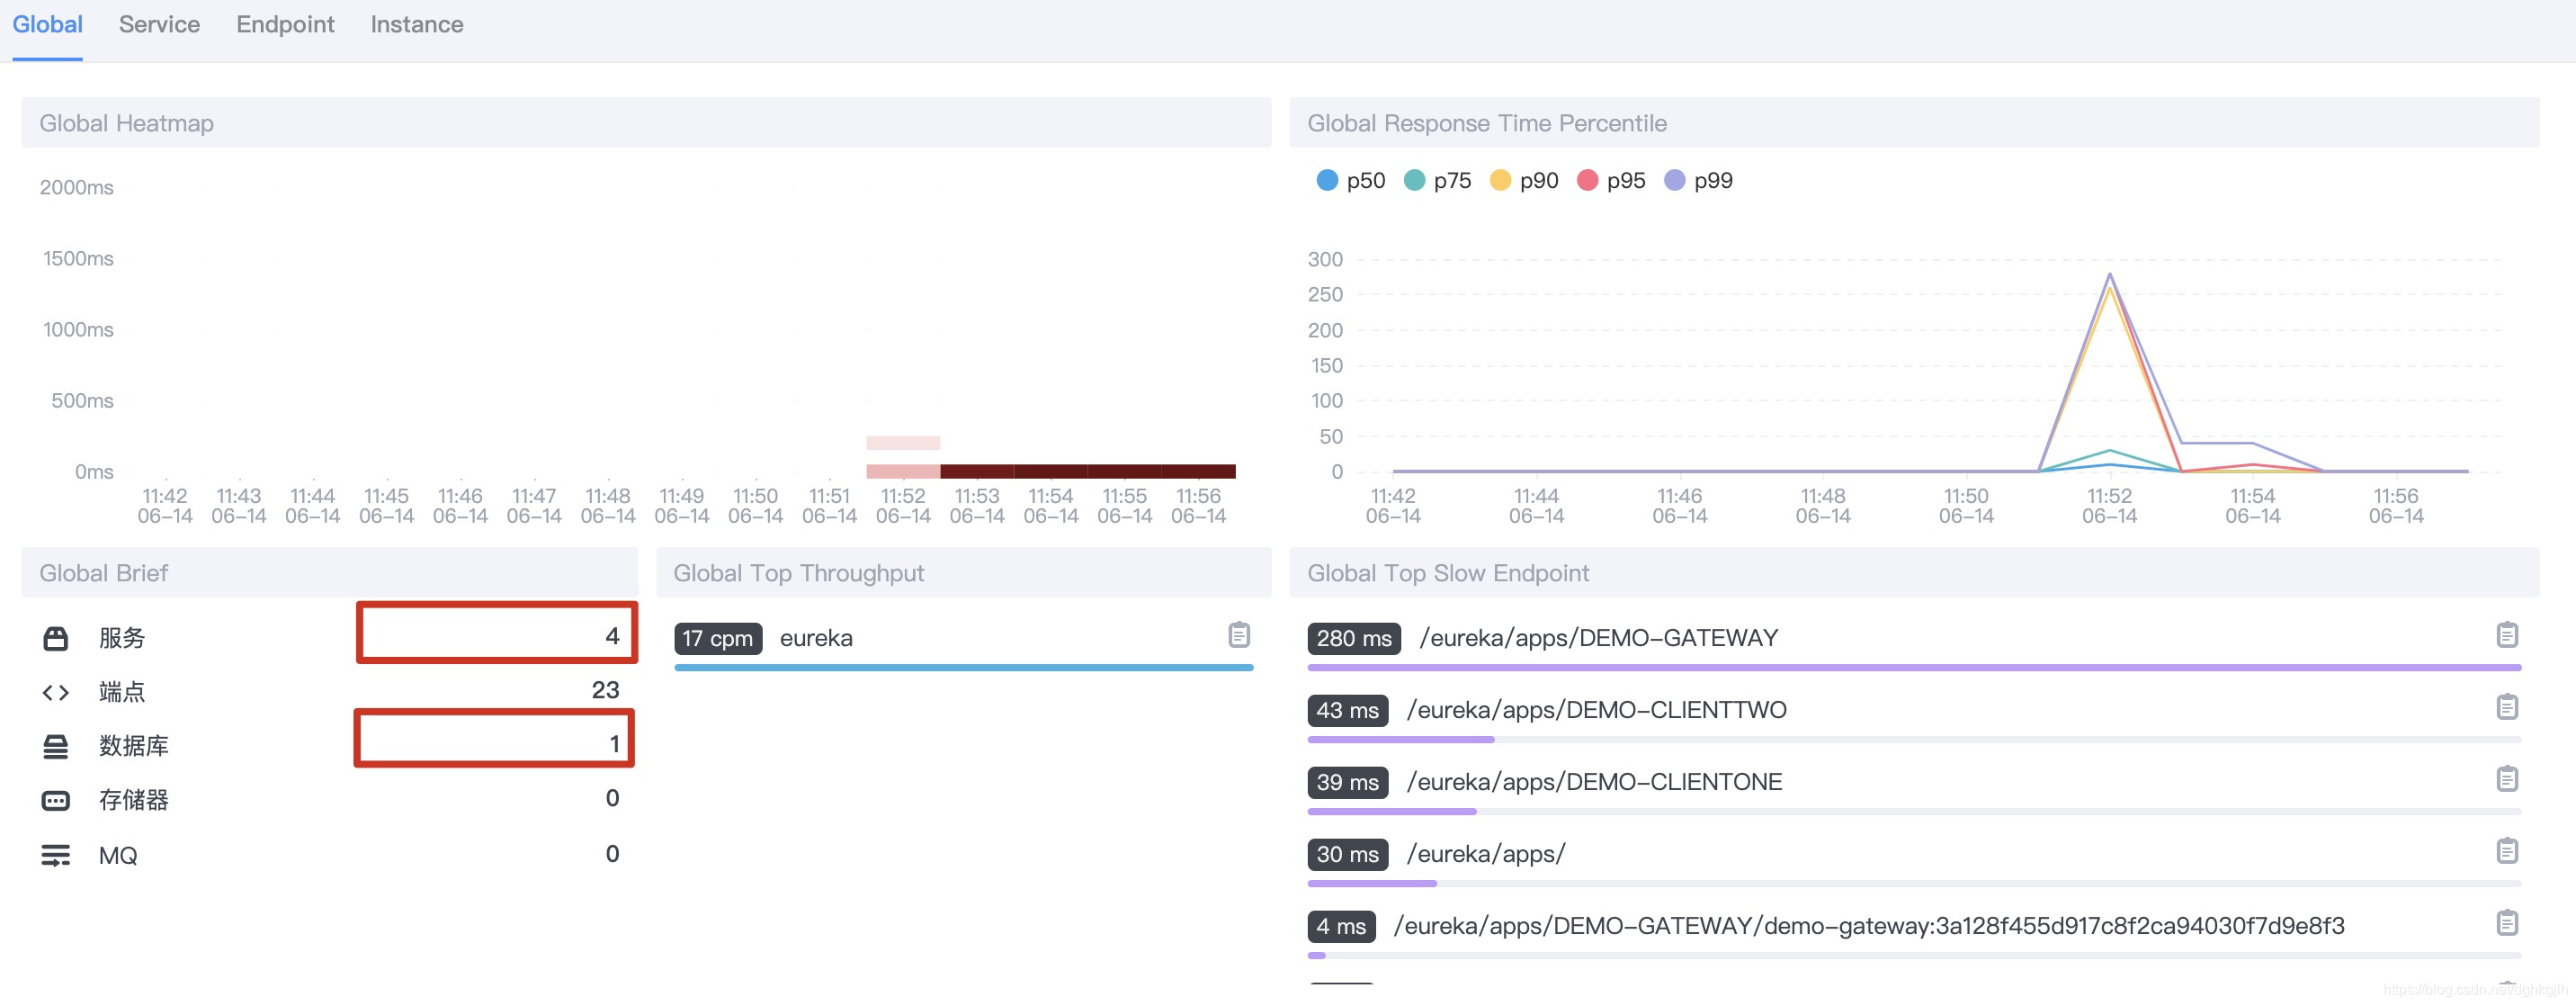
There are four applications and one database, as expected.
Inspect Spring Cloud Call Chains
Monitor Calls Within a Single Microservice
-
Call addSwUser on DemoClientone, an instance of one-service, to insert a record.
After a short wait, the console shows:
1.1 Dashboard: select one-service.
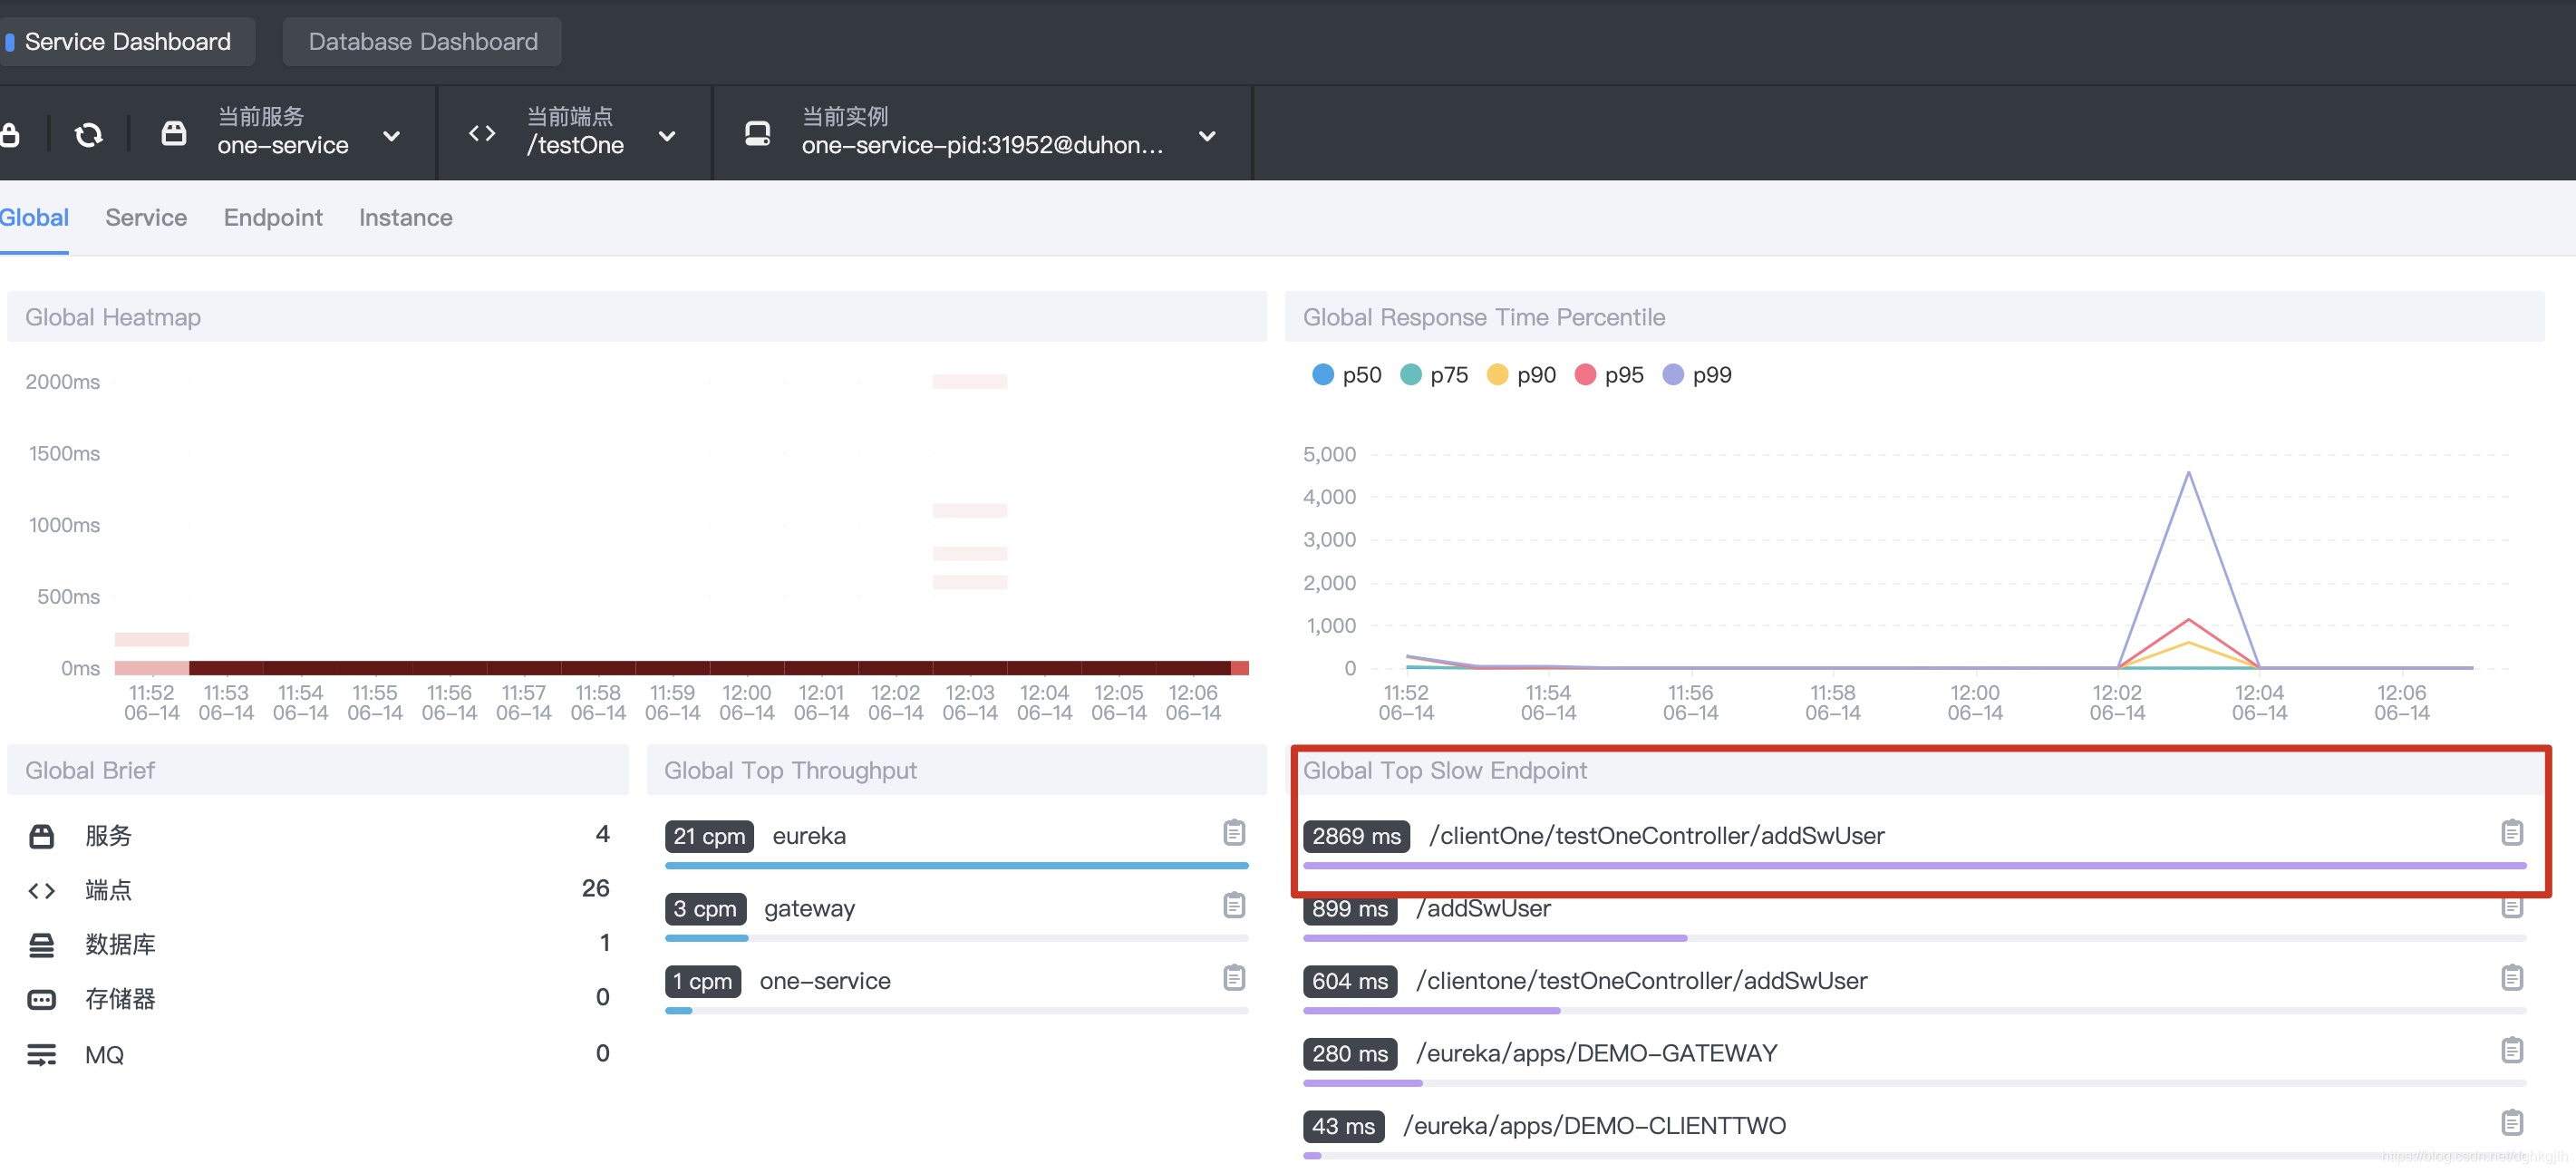
1.2 Topology: select one-service.
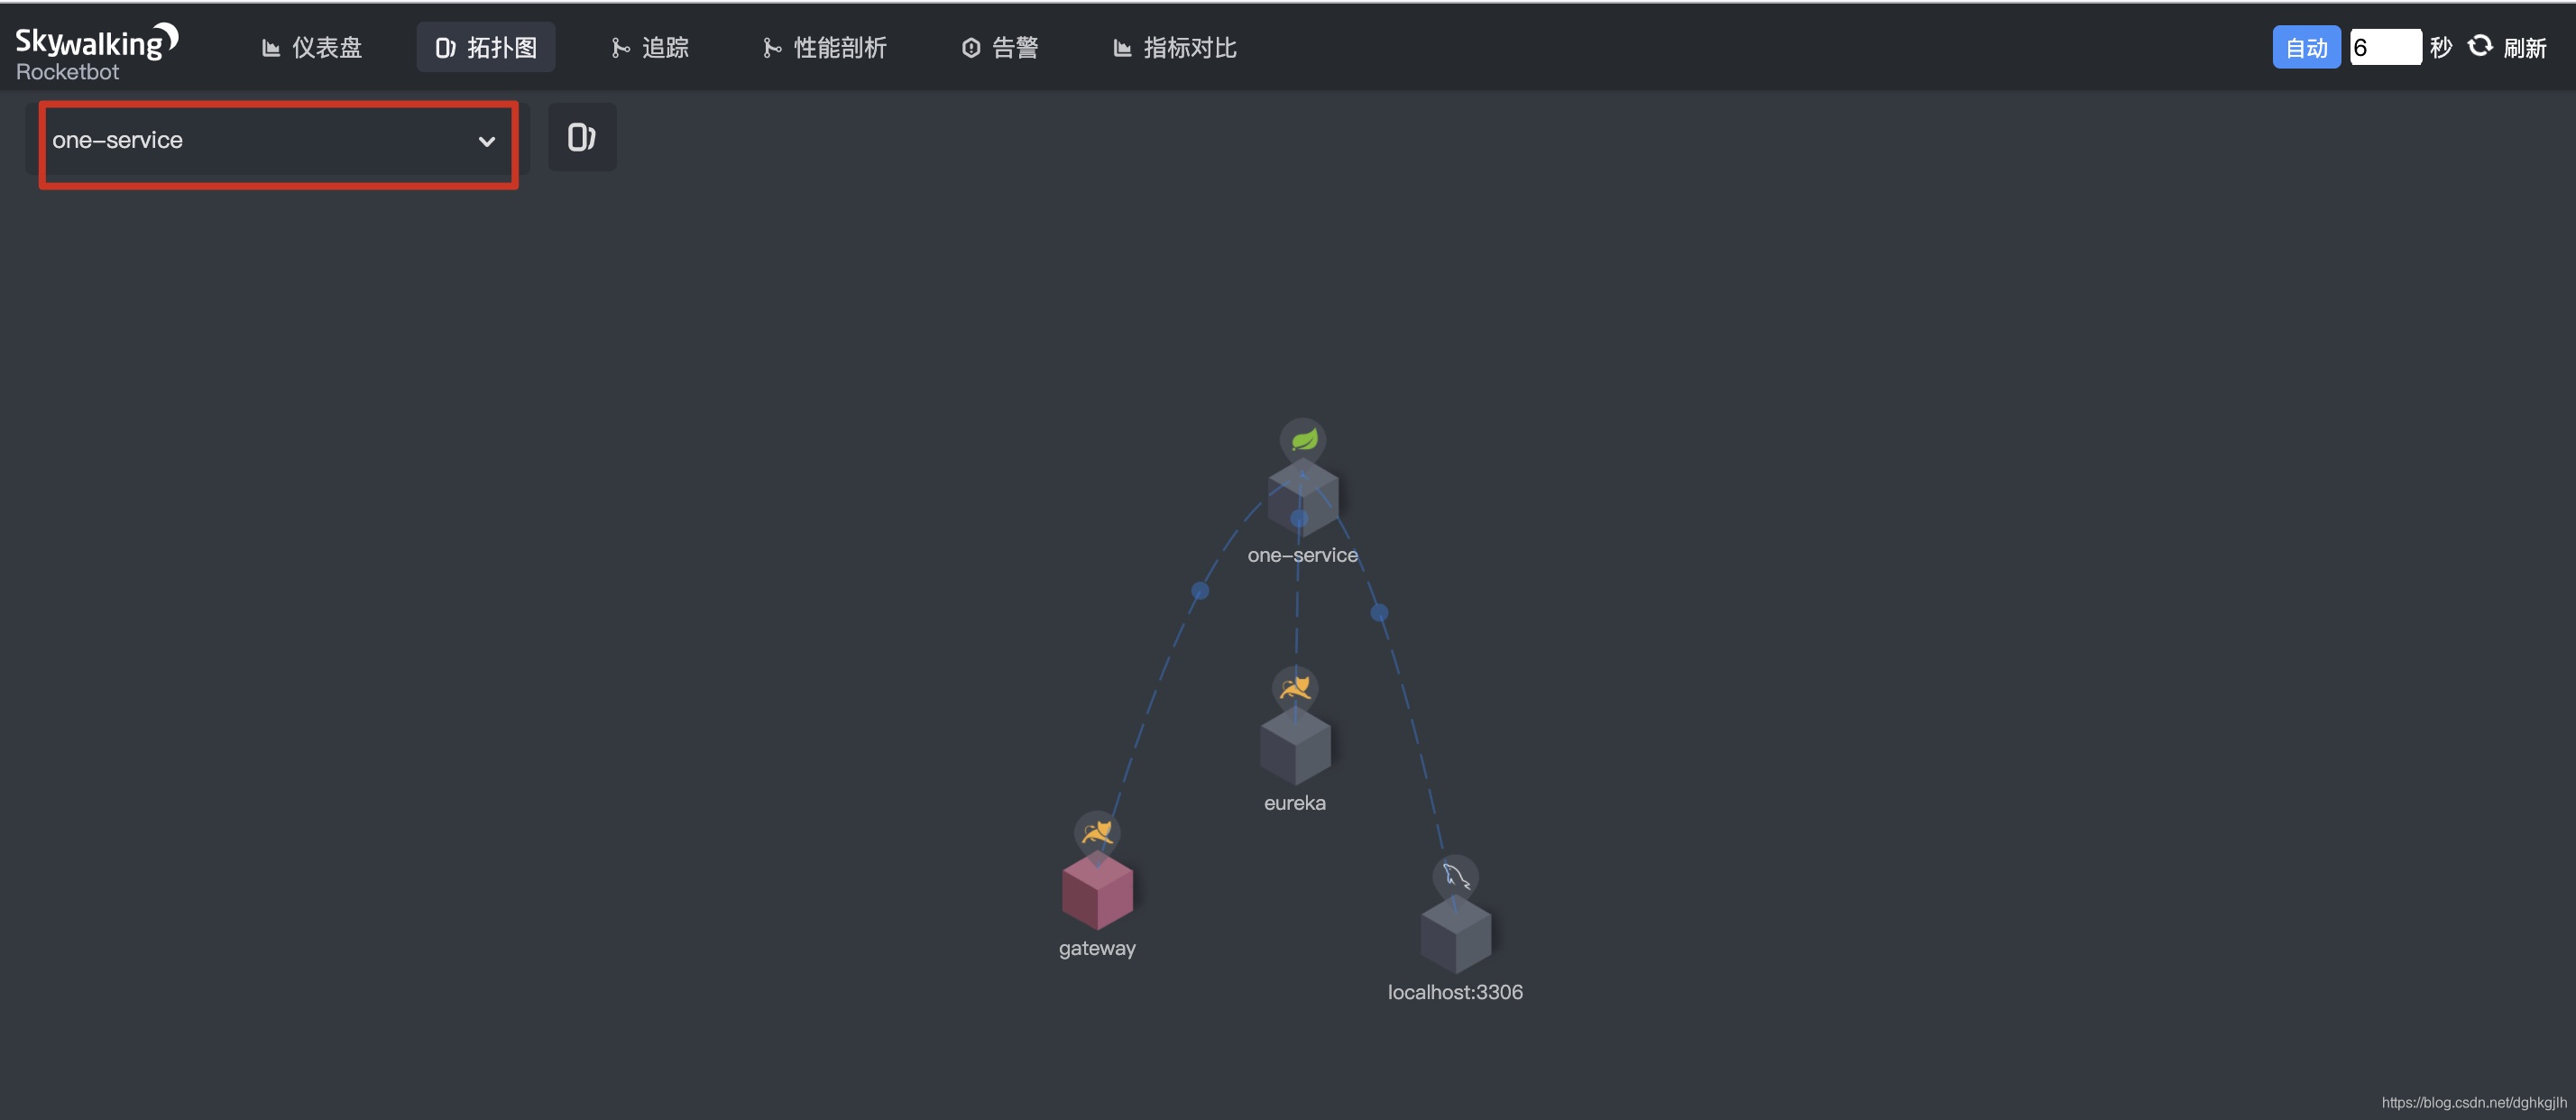
1.3 Trace: select one-service.
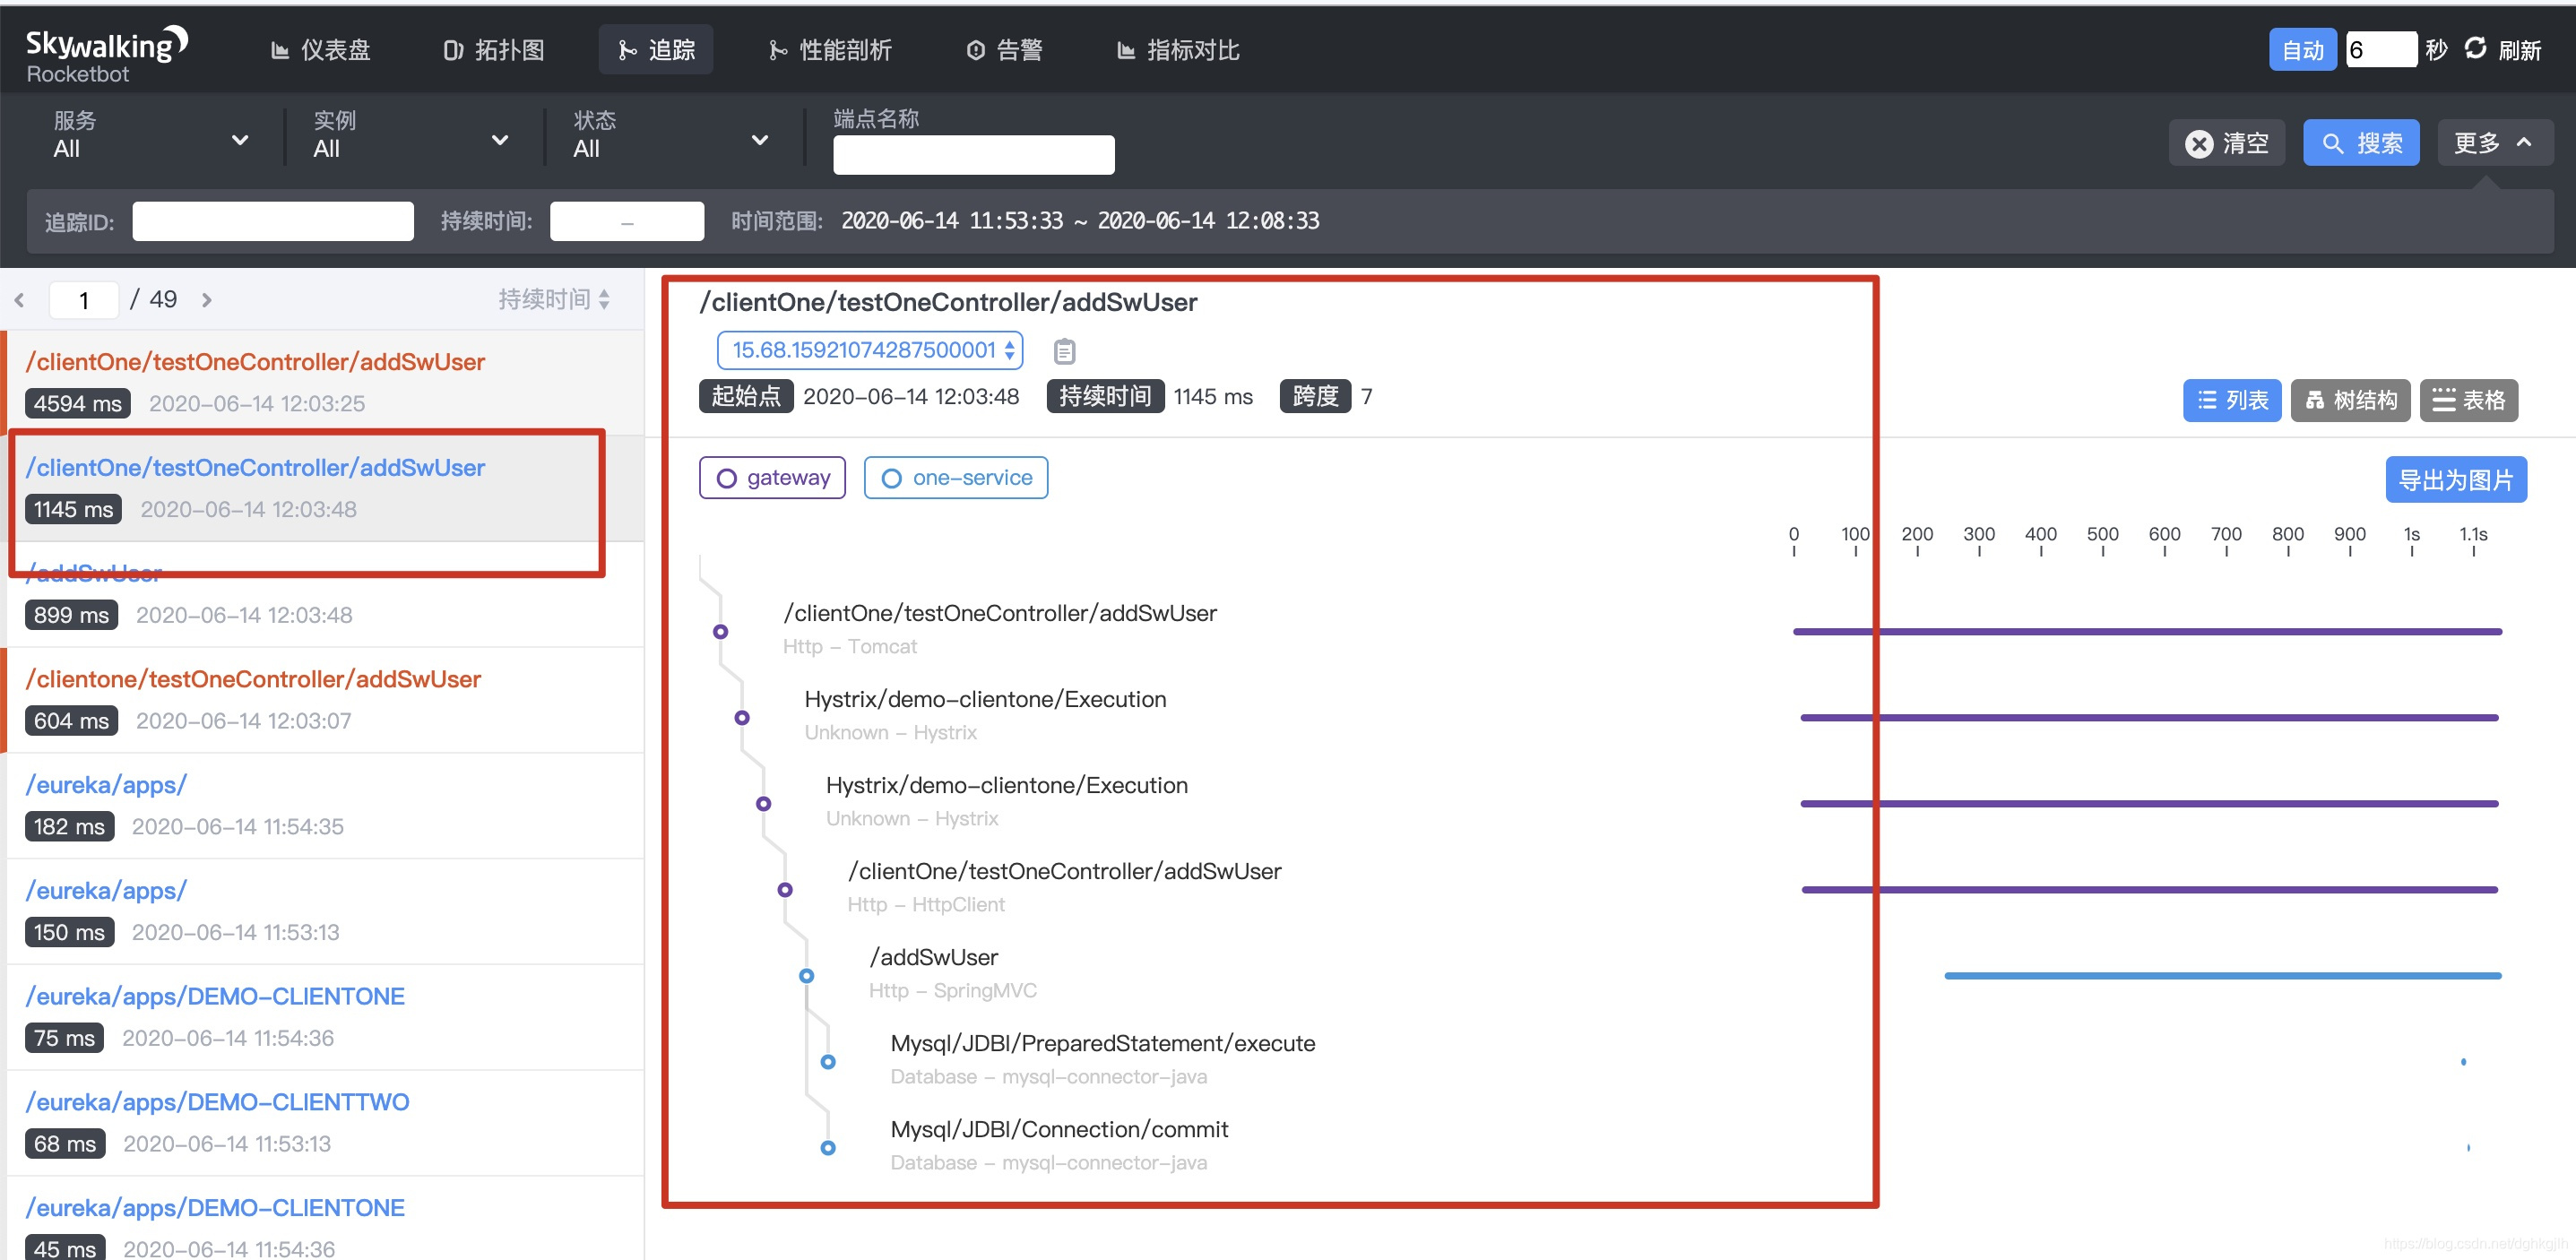
1.4 Click Mysql/JDBC/PrepareStatement/execute in the view above to see:
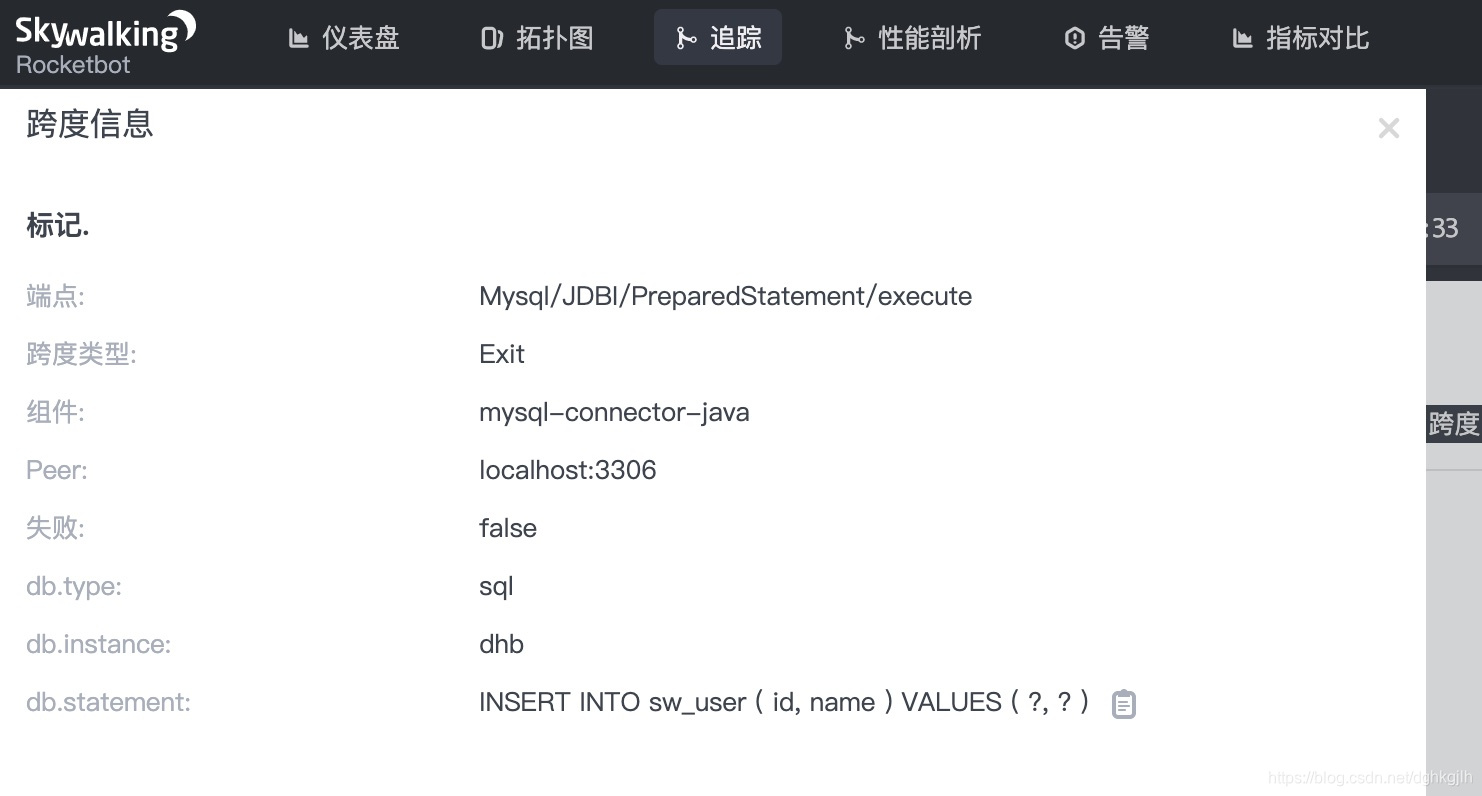 How can we also see the SQL parameters?
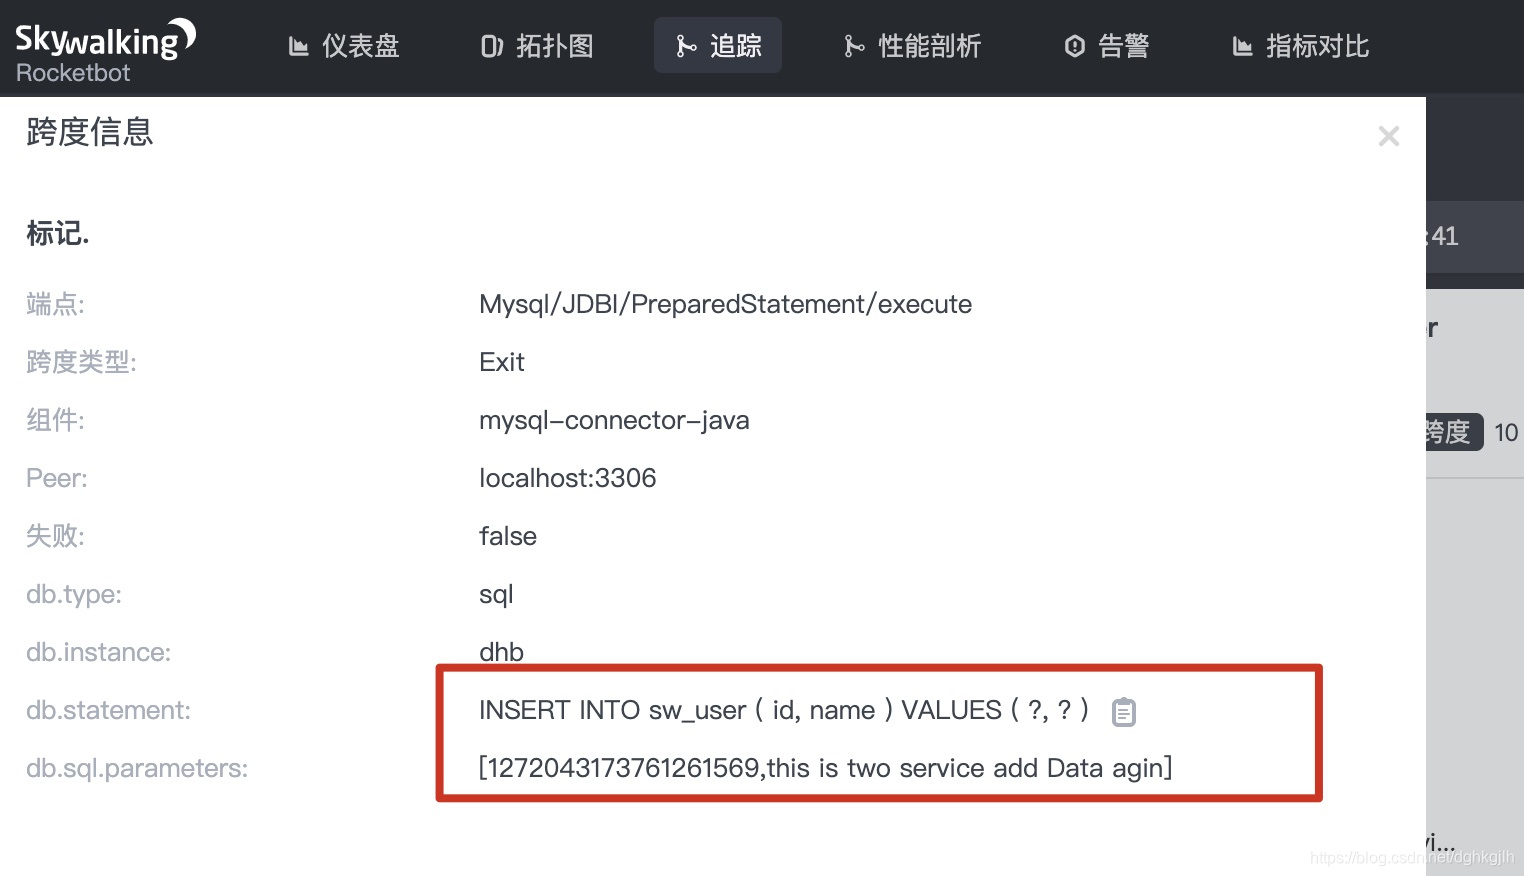
Set the following parameter to true in agent.config:
plugin.mysql.trace_sql_parameters=${SW_MYSQL_TRACE_SQL_PARAMETERS:true}After configuring it, restart and call the API again. The SQL call in the trace now looks like this:
Monitor Calls Between Microservices
- For service-to-service calls, an external request goes to two-service. DemoClienttwo load-balances calls to the two one-service instances, DemoClientone and DemoClientthree.
After a short wait, the console shows:
.1 Dashboard: select two-service.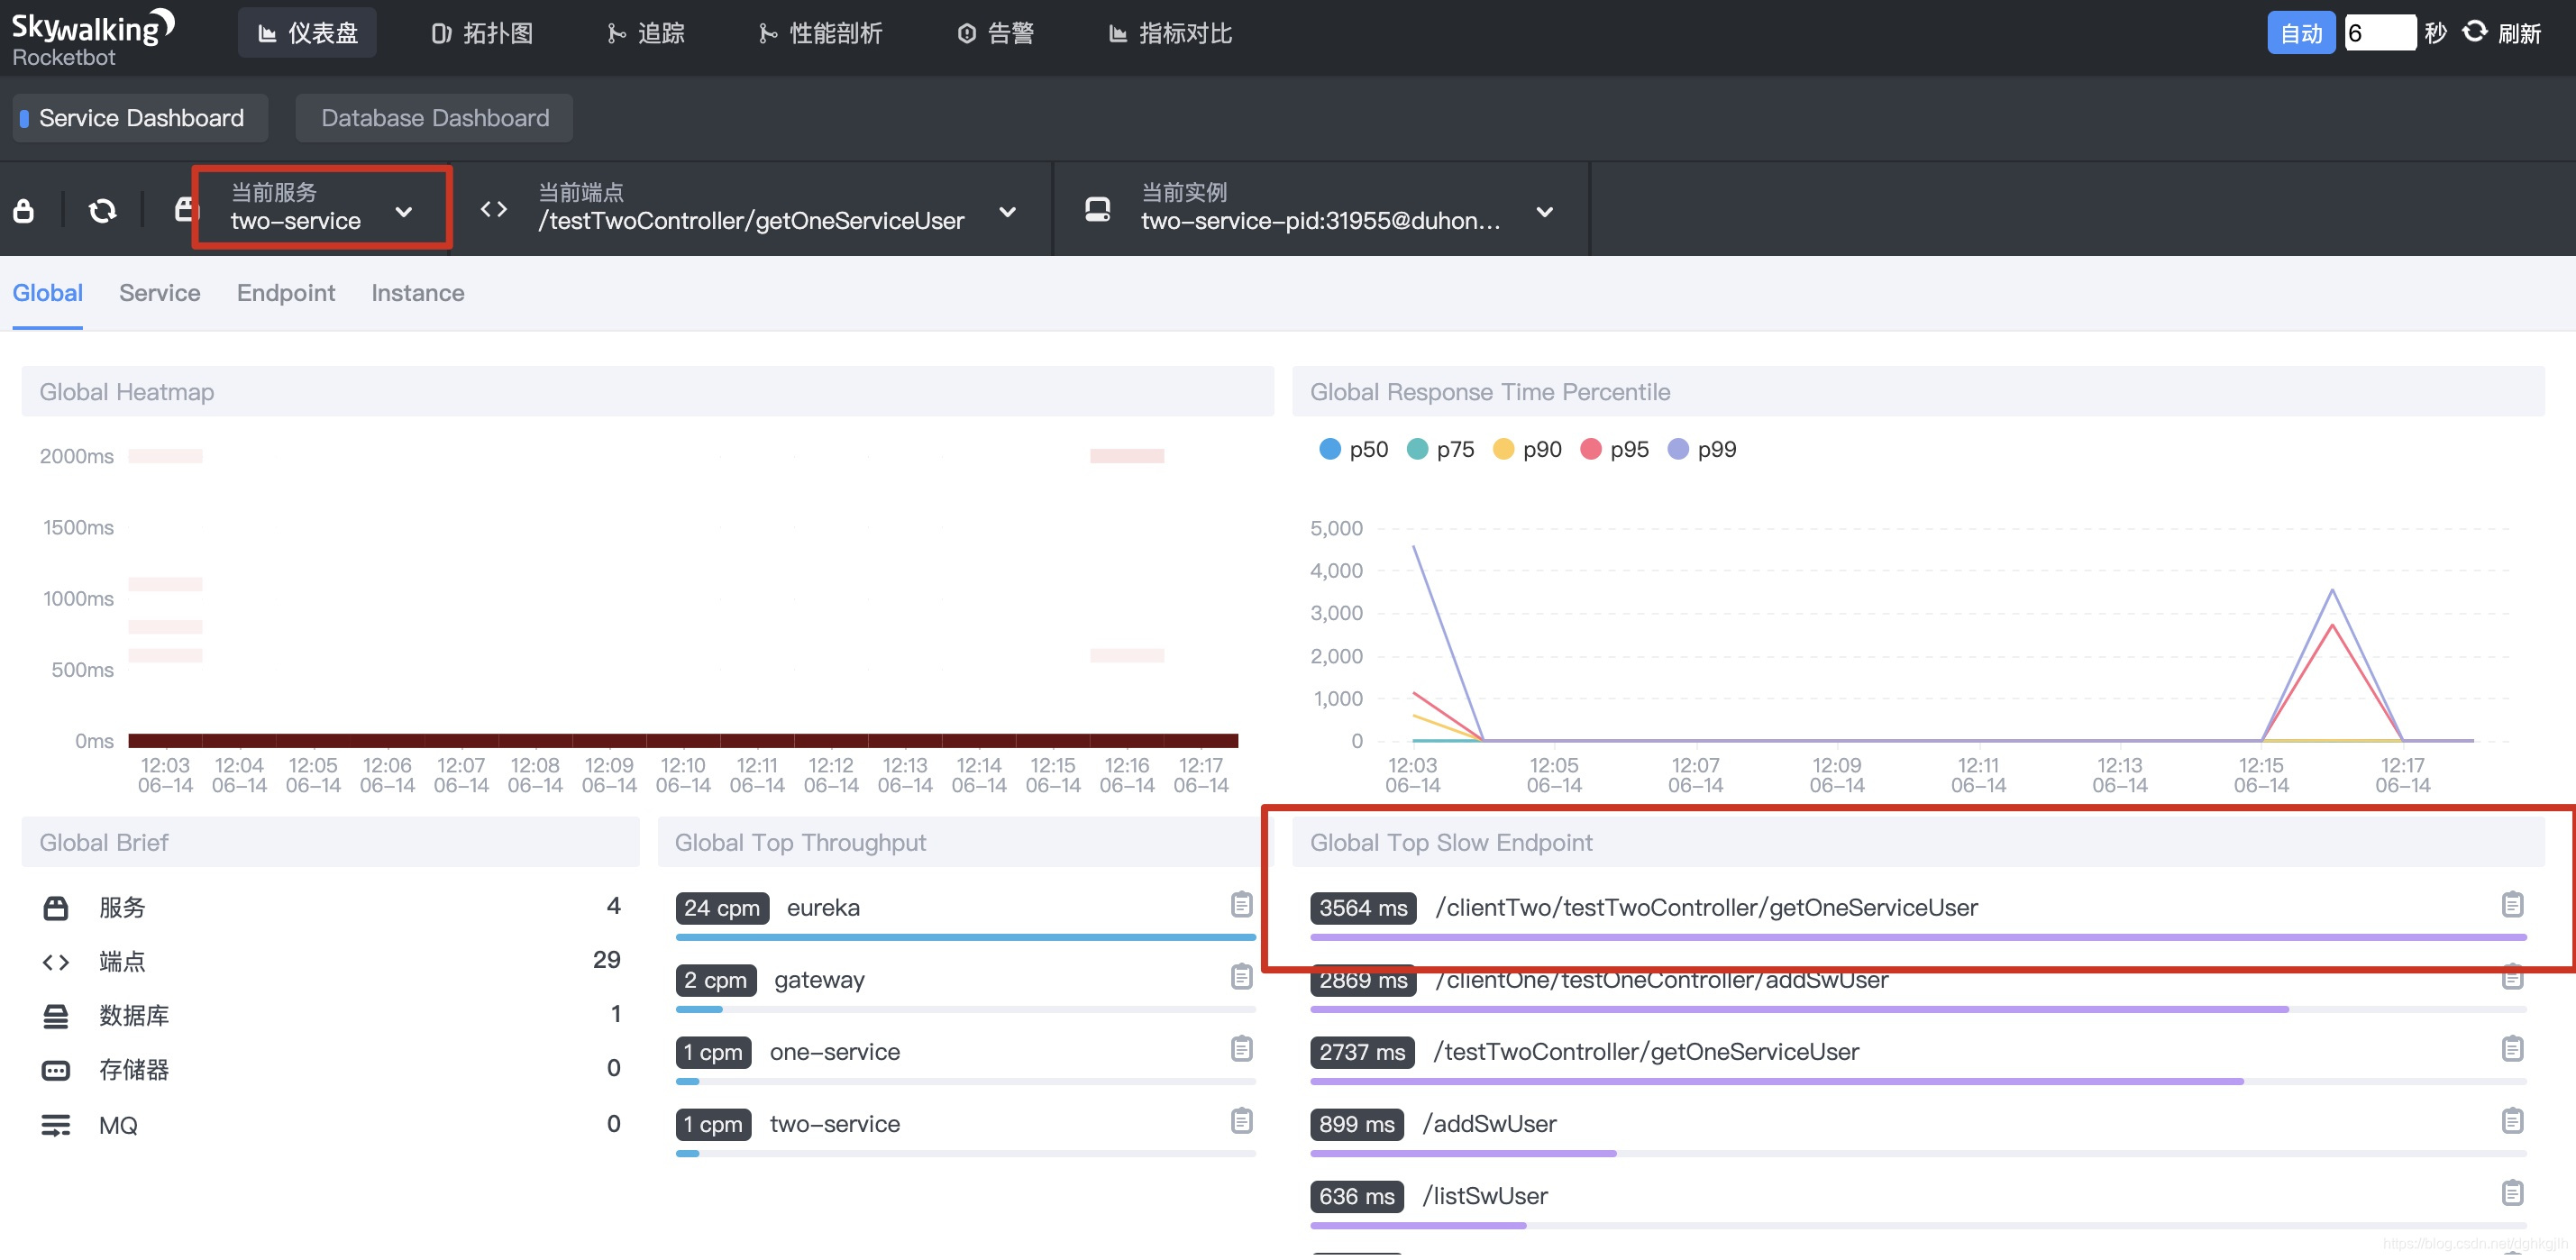
1.2 Topology: select two-service.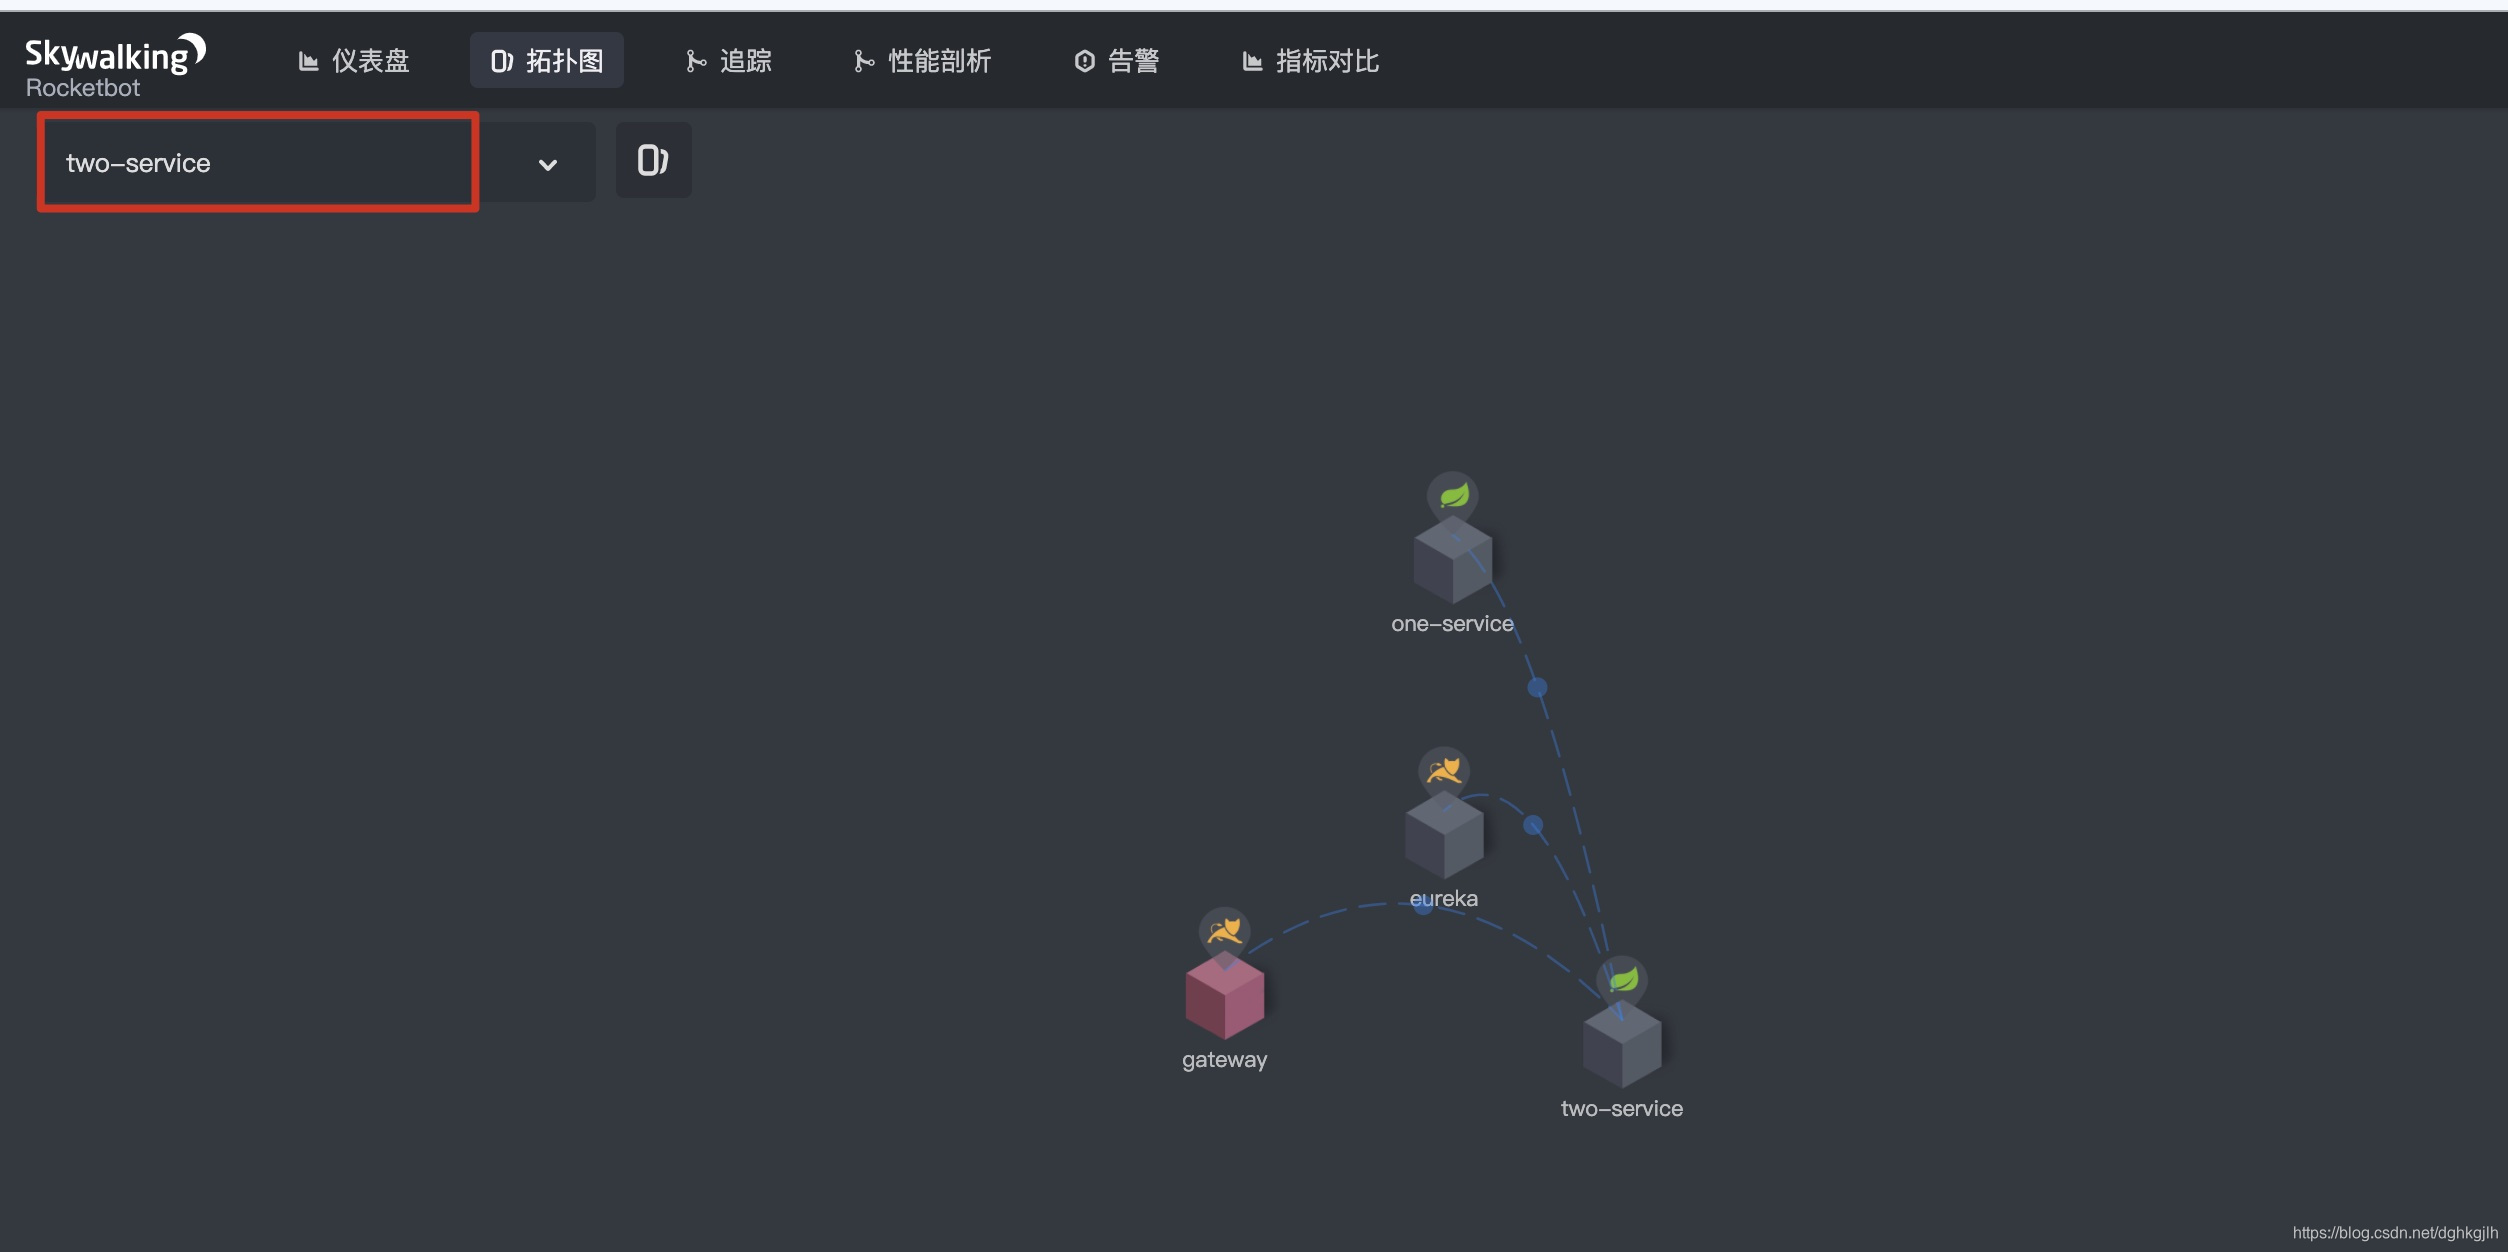
1.3 Trace: select two-serivce.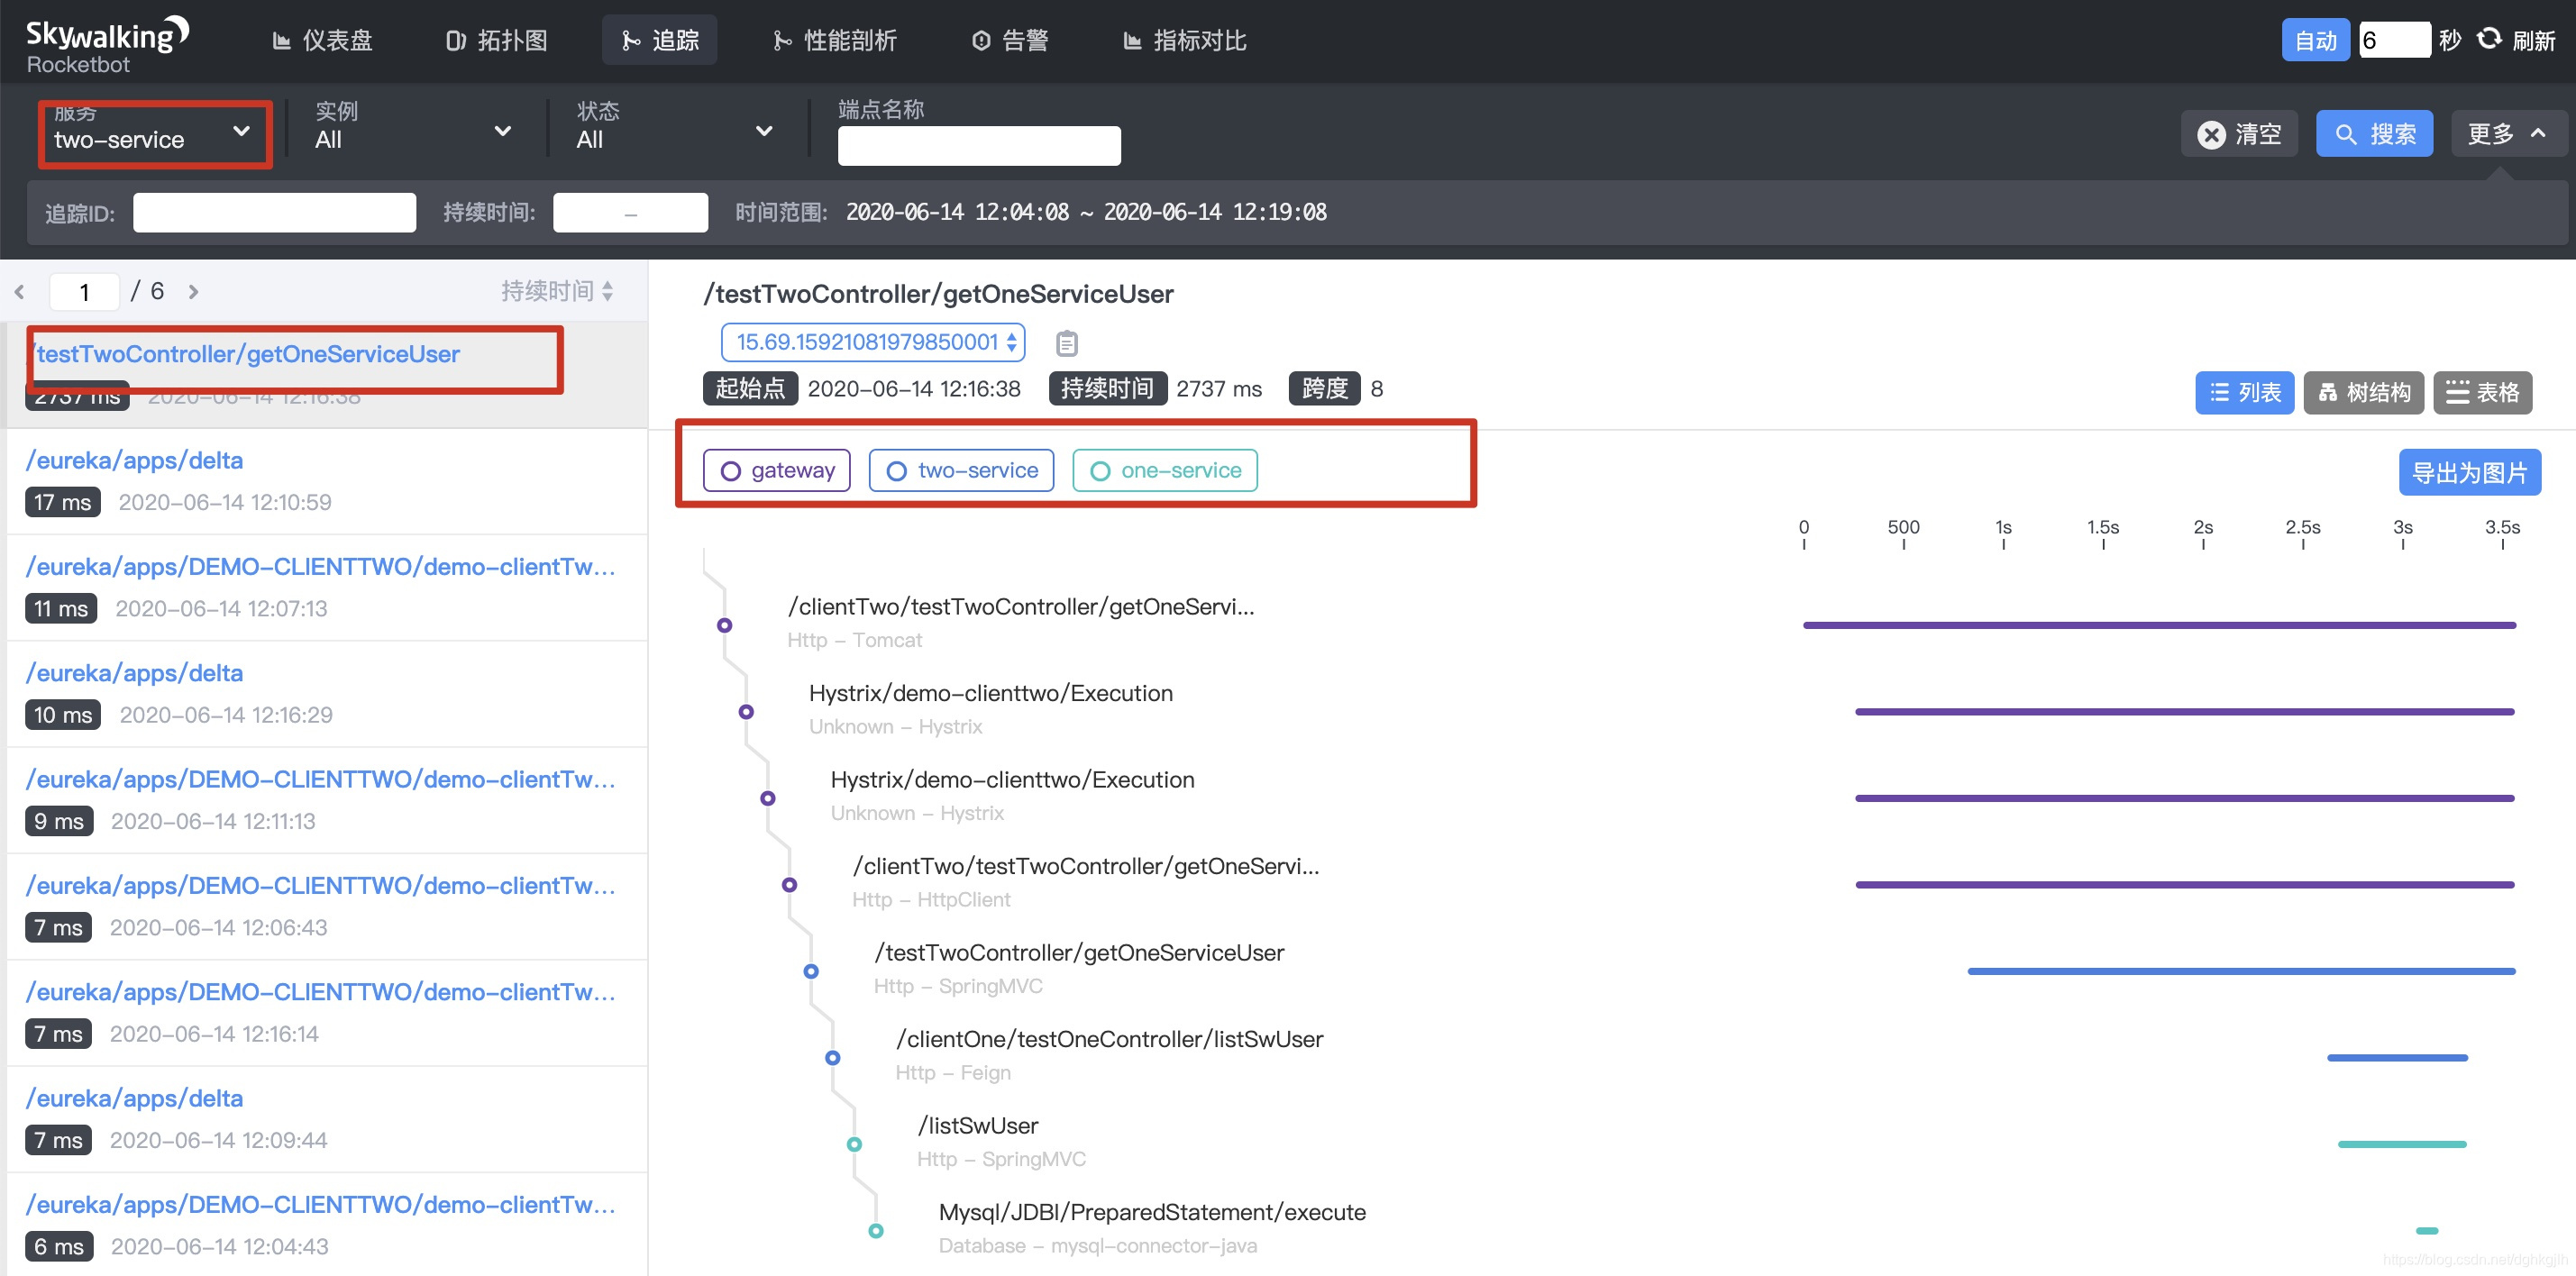
The full call chain is gateway -> two-service -> one-service.
1.4 Click Mysql/JDBC/PrepareStatement/execute above to see: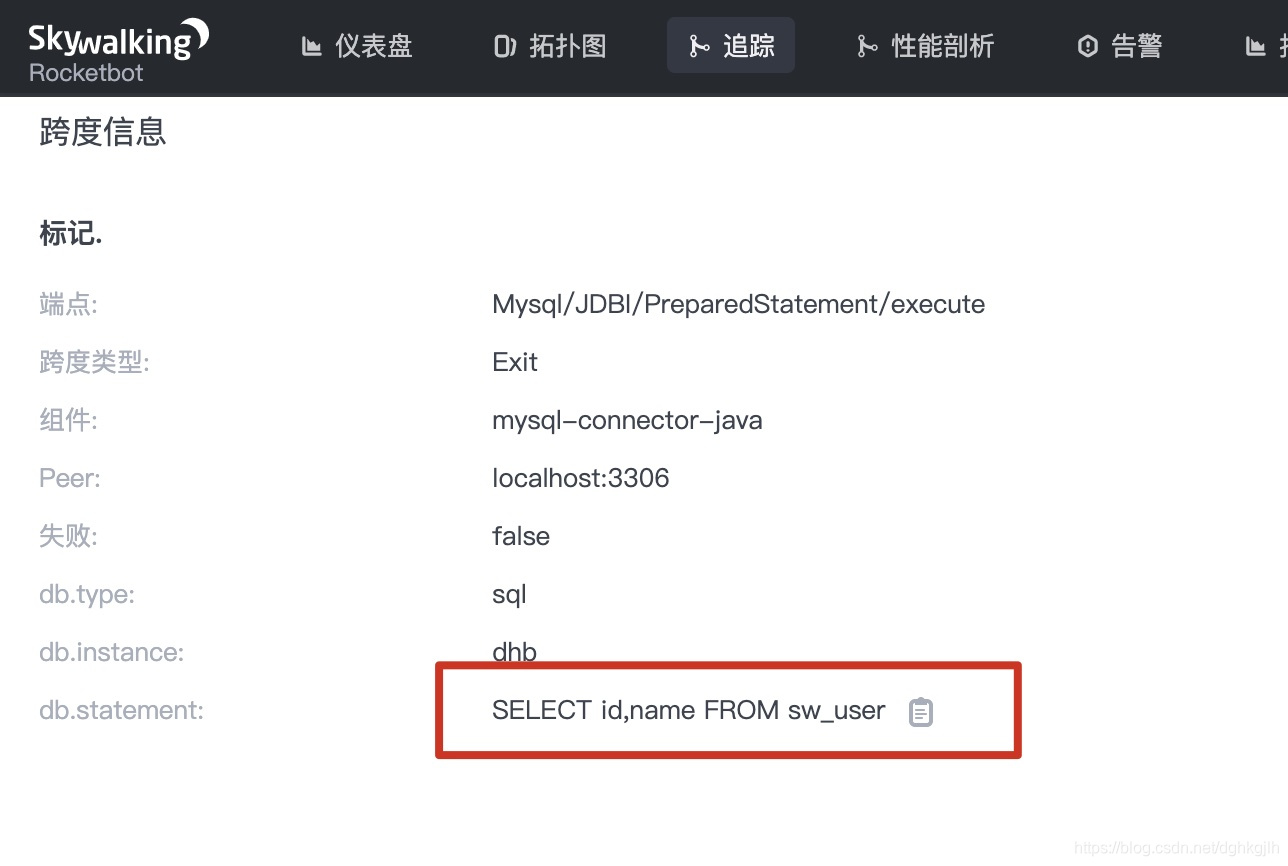
Call Chains Across All Microservices
The topology for all microservice call chains is: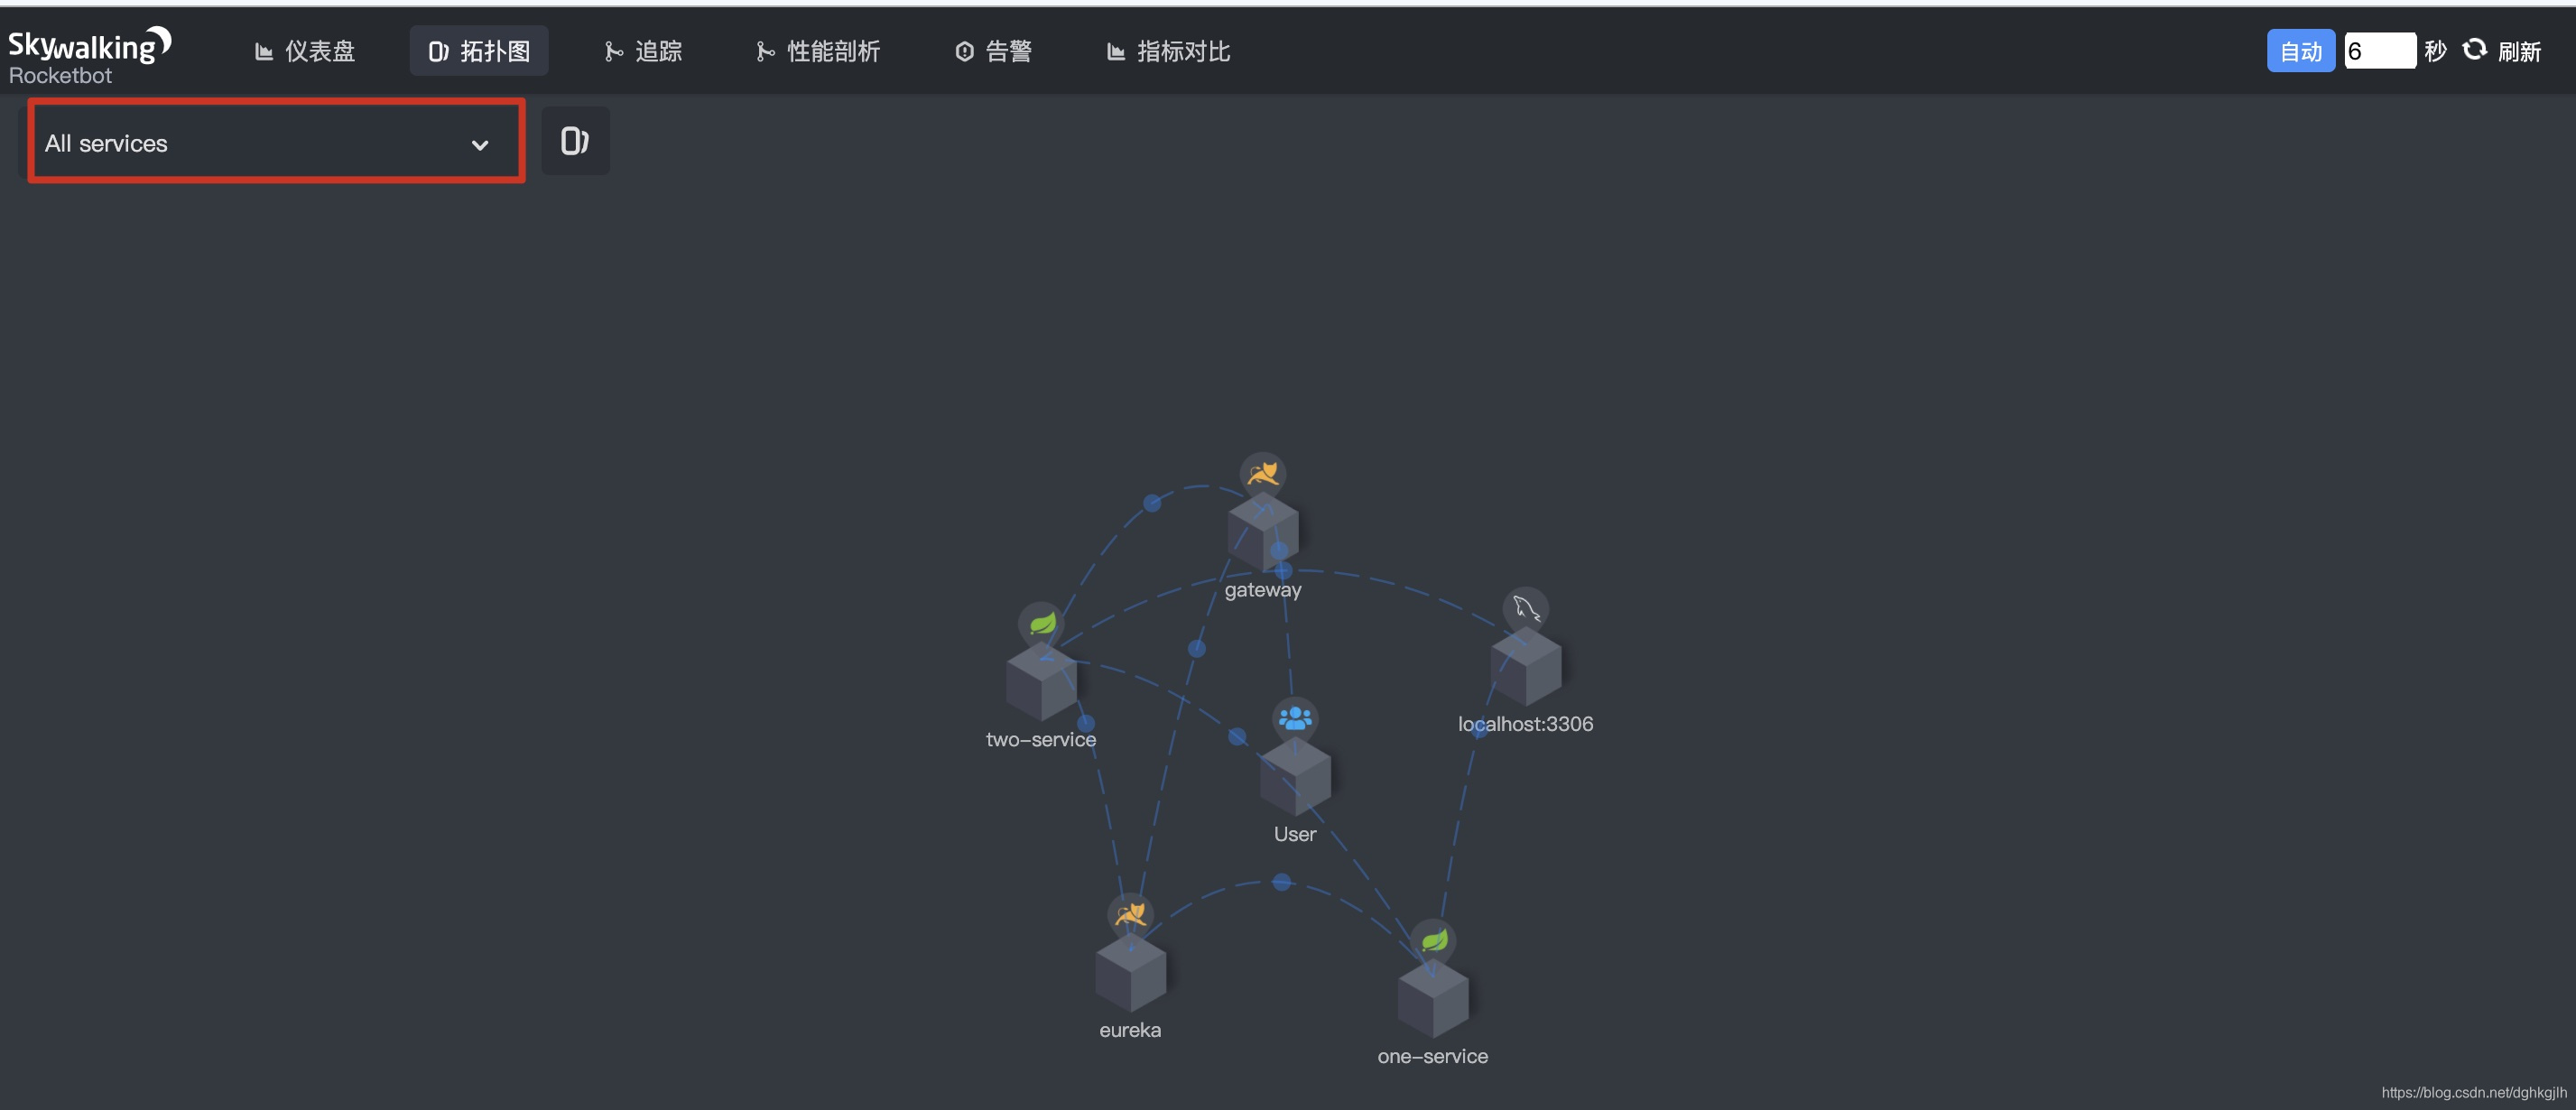
Stop SkyWalking
No official shutdown script is provided; see issue 4698. We therefore have to kill the processes manually.
- Stop the agent.
# We configured port 11800; find the process using it
lsof -i:11800
# Use pkill to kill the parent process directly
pkill -9 34956- Stop the SkyWalking UI server.
# The default port is 8080
kill -9 8080
Stop Elasticsearch
brew service stop elasticsearch-fullSummary
- We quickly used SkyWalking for basic monitoring of a Spring Cloud microservice architecture.
- How do we use alerts?
- These calls only cover microservices, and the setup is simple. For microservice clusters—registry clusters, gateway clusters, and business-service clusters (multiple instances of one service)—how can SkyWalking be integrated smoothly and detect their services?
- How can cluster configuration be combined with a configuration center to simplify it?
- Since a gateway cluster may sit behind an nginx cluster, how can nginx also be brought under SkyWalking management?