Table of contents
Open Table of contents
- Installing JMeter and Groovy
- Load Testing Requirements and Approach
- Preparing the JMeter Script and Verifying Its Correctness
- Using the Test Script Recorder to Capture the APIs Involved in the Entire Business Line
- Configuring the Test Script Recorder
- Making the APIs Dynamic
- Handling Global Variables and Naming Each API
- Script Processing Before and After an API Request
- Using the JSR223 PreProcessor to Read Item IDs
- Requesting the API
- Using the Regular Expression Extractor Post-Processor to Handle the API Response and Set Variables for the Next API
- Using the Debug Sampler or Debug PostProcessor to Debug the Script
- Moving On to the Next API
- Dynamic Handling When a Form Field Is Submitted with Multiple Values
- Use CLI Mode for Load Testing in Real Scenarios
- Undoing Certain Changes in JMeter
- Conclusion
Installing JMeter and Groovy
On macOS, install them with Homebrew
brew install jmeter
brew install groovy
After the installation finishes, make sure JMeter and Groovy are working properly
Start JMeter directly
jmeterCheck the Groovy version
groovy -vWhy Groovy?
For scripting languages in JMeter there are BeanShell and Groovy; I chose Groovy because it’s closer to Java. Although I had never touched Groovy before, getting up to speed went fairly smoothly with the help of my IDE, the official documentation, and Google.
Load Testing Requirements and Approach
Because what I needed was to load test an entire business flow, the requests and responses of the various APIs had to depend on each other. In that respect it was a bit like an automated testing flow, except that automated testing focuses on verifying whether the results of the test flow are correct, while the load testing here focuses on whether certain APIs have problems.
Since I’m not part of the automated testing team, when I received this requirement, my first thought was how to prepare the test data?
What we’re load testing is the user purchase flow, but before a user can purchase anything, the merchant has to create the items and, depending on the business, set some special attributes on them, such as item display settings, purchase limits, discounts, and so on. All of this is actually data preparation.
After all, we’d like the load test to be automated too, and if it were fully automated, the data preparation scripts would have to be written as well — but that part actually duplicates the automated testing work. After thinking it over, I decided to make it semi-automated. That is, the prepared data comes from the automated tests: first run the automated tests to generate the base prepared data, then manually do some additional configuration on top of that base data, such as giving an item a lot of stock. Because our automated tests don’t create items with a lot of stock, while the load test must run on the premise of large stock quantities, this step is done through manual configuration, and only then is the load test run. That’s the general idea; it’s not perfect, but it basically keeps the focus of the work on preparing and testing the load test scripts rather than on preparing data.
Preparing the JMeter Script and Verifying Its Correctness
Since the entire business line involves a large number of APIs, I’ll only use a few of them as examples here; the configuration approach and debugging method are basically the same for every API.
Using the Test Script Recorder to Capture the APIs Involved in the Entire Business Line
Why Use the Test Script Recorder?
If you don’t know the Test Script Recorder, I suggest reading through the official documentation first. To sum it up in one sentence: it records all the requests involved in your clicking around on the pages and generates a collection of them.
The reality often looks like this:
- The development team has no API management tool (or even if it does), the person writing the load test script doesn’t necessarily know exactly which APIs are involved in the business line under test — the people writing the load tests are not the same people who developed it. In this situation, it’s unrealistic to spend a lot of additional time learning the business, the API request parameters, the API responses, and so on.
- The business line as a whole has many APIs and is complex, with all kinds of situations (which is very common in reality), and the particular scenario we want to test on this line may not require sending certain parameters or handling certain responses, so we also don’t need to spend much time figuring out exactly what should be sent.
- It’s convenient: you don’t have to create the relevant HTTP Request Sampler yourself one API at a time; you only need to make some parameters dynamic. This greatly reduces our workload.
We just need to use the Test Script Recorder and, as in functional testing, click all the way through the pages following the flow we want to test and complete the business process normally — and we get all the request APIs on that test flow.
Configuring the Test Script Recorder
Just refer directly to the Test Script Recorder section of the official JMeter documentation.
Note: the browser must be the Iceweasel/Firefox mentioned in the official documentation. I saw the documentation at the very beginning too, but naively assumed any browser would do; after trying Chrome and Edge without success, I obediently downloaded Firefox.
Before recording a script, you need to install the certificate generated by JMeter into Firefox; for the detailed steps, see the official documentation section on how to install the HTTPS certificate
Tips: when using the Test Script Recorder, a web page may have many requests we don’t care about, such as various css, jpg, and properties files. We don’t want to record these requests, so we can filter them out; the path is at 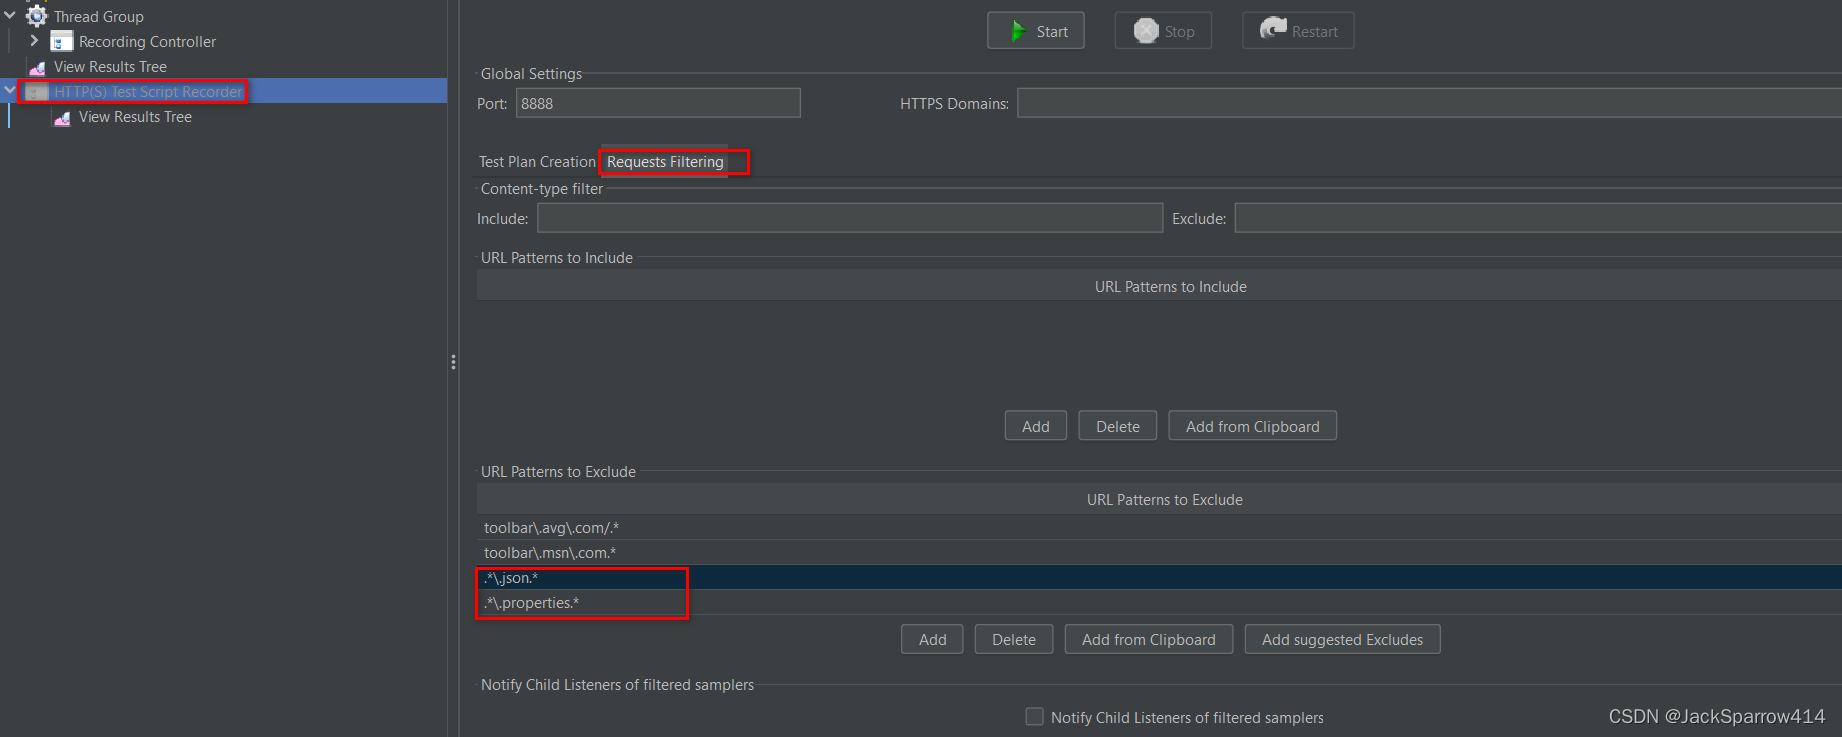 This way, the API collection we end up with is very clean. In the HTTP(S) Test Script Recorder you can see this is grayed out by default — that’s fine, you don’t need to enable it; requests are automatically recorded under the Recording Controller.
Making the APIs Dynamic
At this point, you should have the Test Script Recorder running successfully on your machine and have obtained the relevant API collection. If not, I suggest reading the official documentation mentioned above, and only continue with this part after making sure you have the API collection.
Handling Global Variables and Naming Each API
Put the scheme, host, port, and contextPath that every API uses into User Defined Variables, 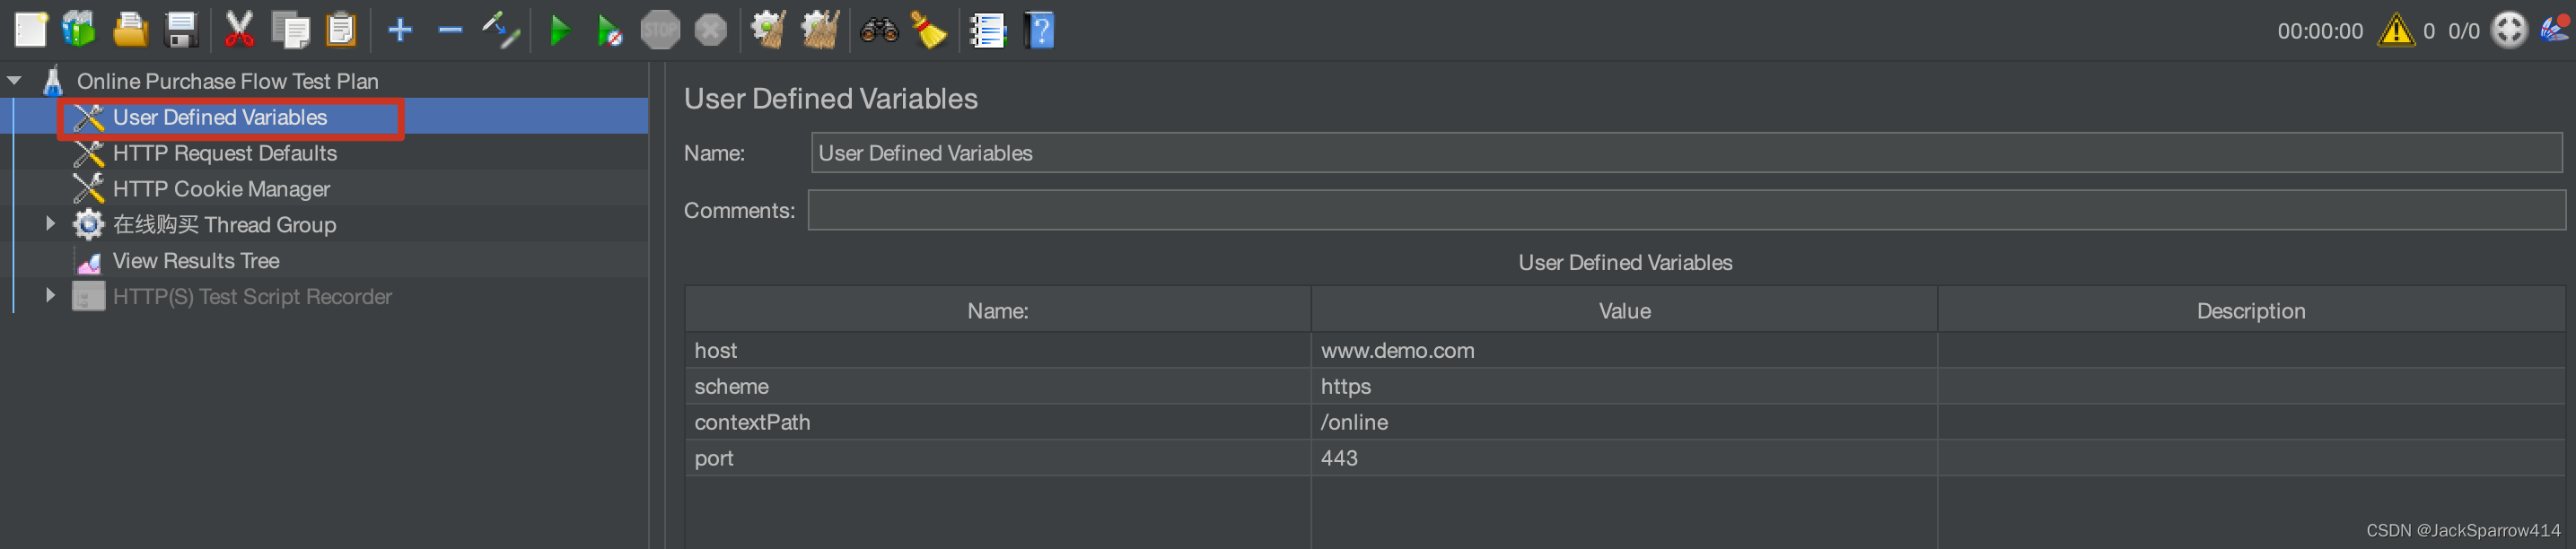 and reference them in HTTP Request Defaults,
 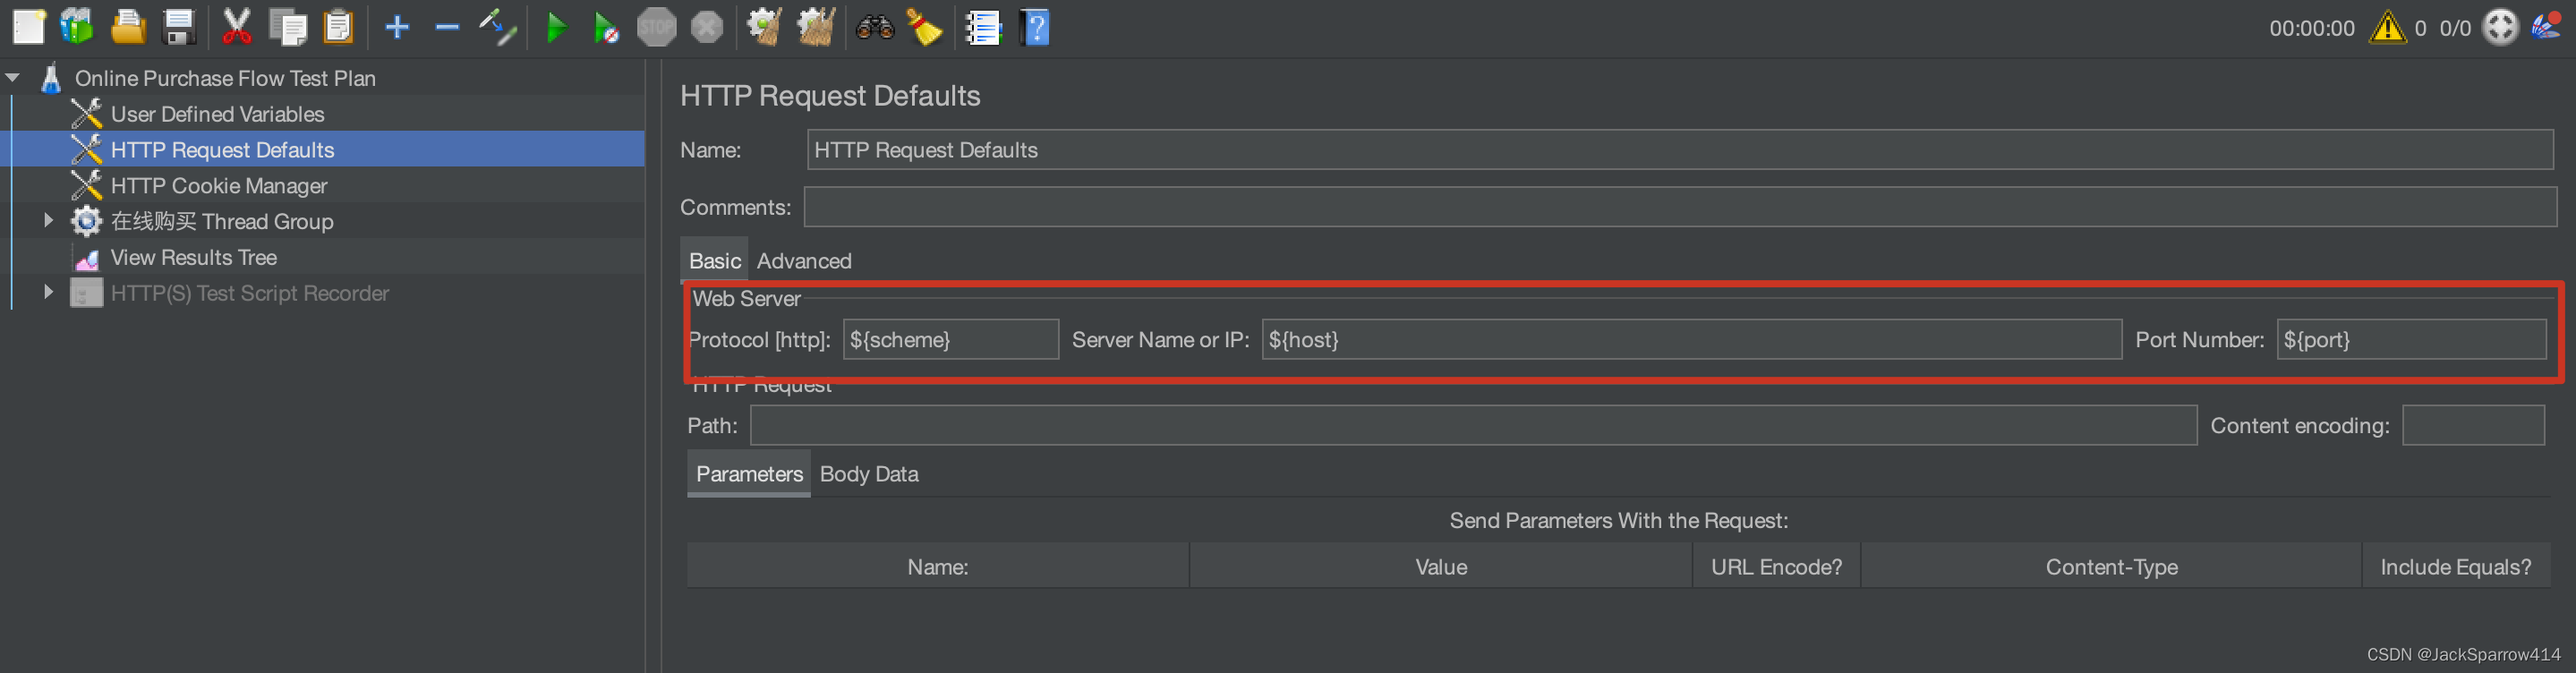 For each API, it’s best to rename each HTTP Request Sampler so that it reflects the function that Sampler corresponds to. Not only does this make the name self-explanatory; for more complex load tests in the future, which we may implement using multiple Test Fragments, it also helps us split or refactor the load test script later on — we won’t have to spend time figuring out what a script is actually for just because of all kinds of bizarre names.
Script Processing Before and After an API Request
The request data of every API is dynamic, while the data in the API collection we obtained with the Test Script Recorder is static; this step is about turning that data into dynamic data. The ones that do this work are the Pre Processors and Post-Processors.
As we said earlier, the base data for the load test comes from the automated tests. Fortunately, the automated testing team writes the key information generated during the testing process, such as merchant IDs and item IDs, into a file, so before requesting an API we need to read that file to get the list of item IDs and randomly obtain one item ID.
Using the JSR223 PreProcessor to Read Item IDs
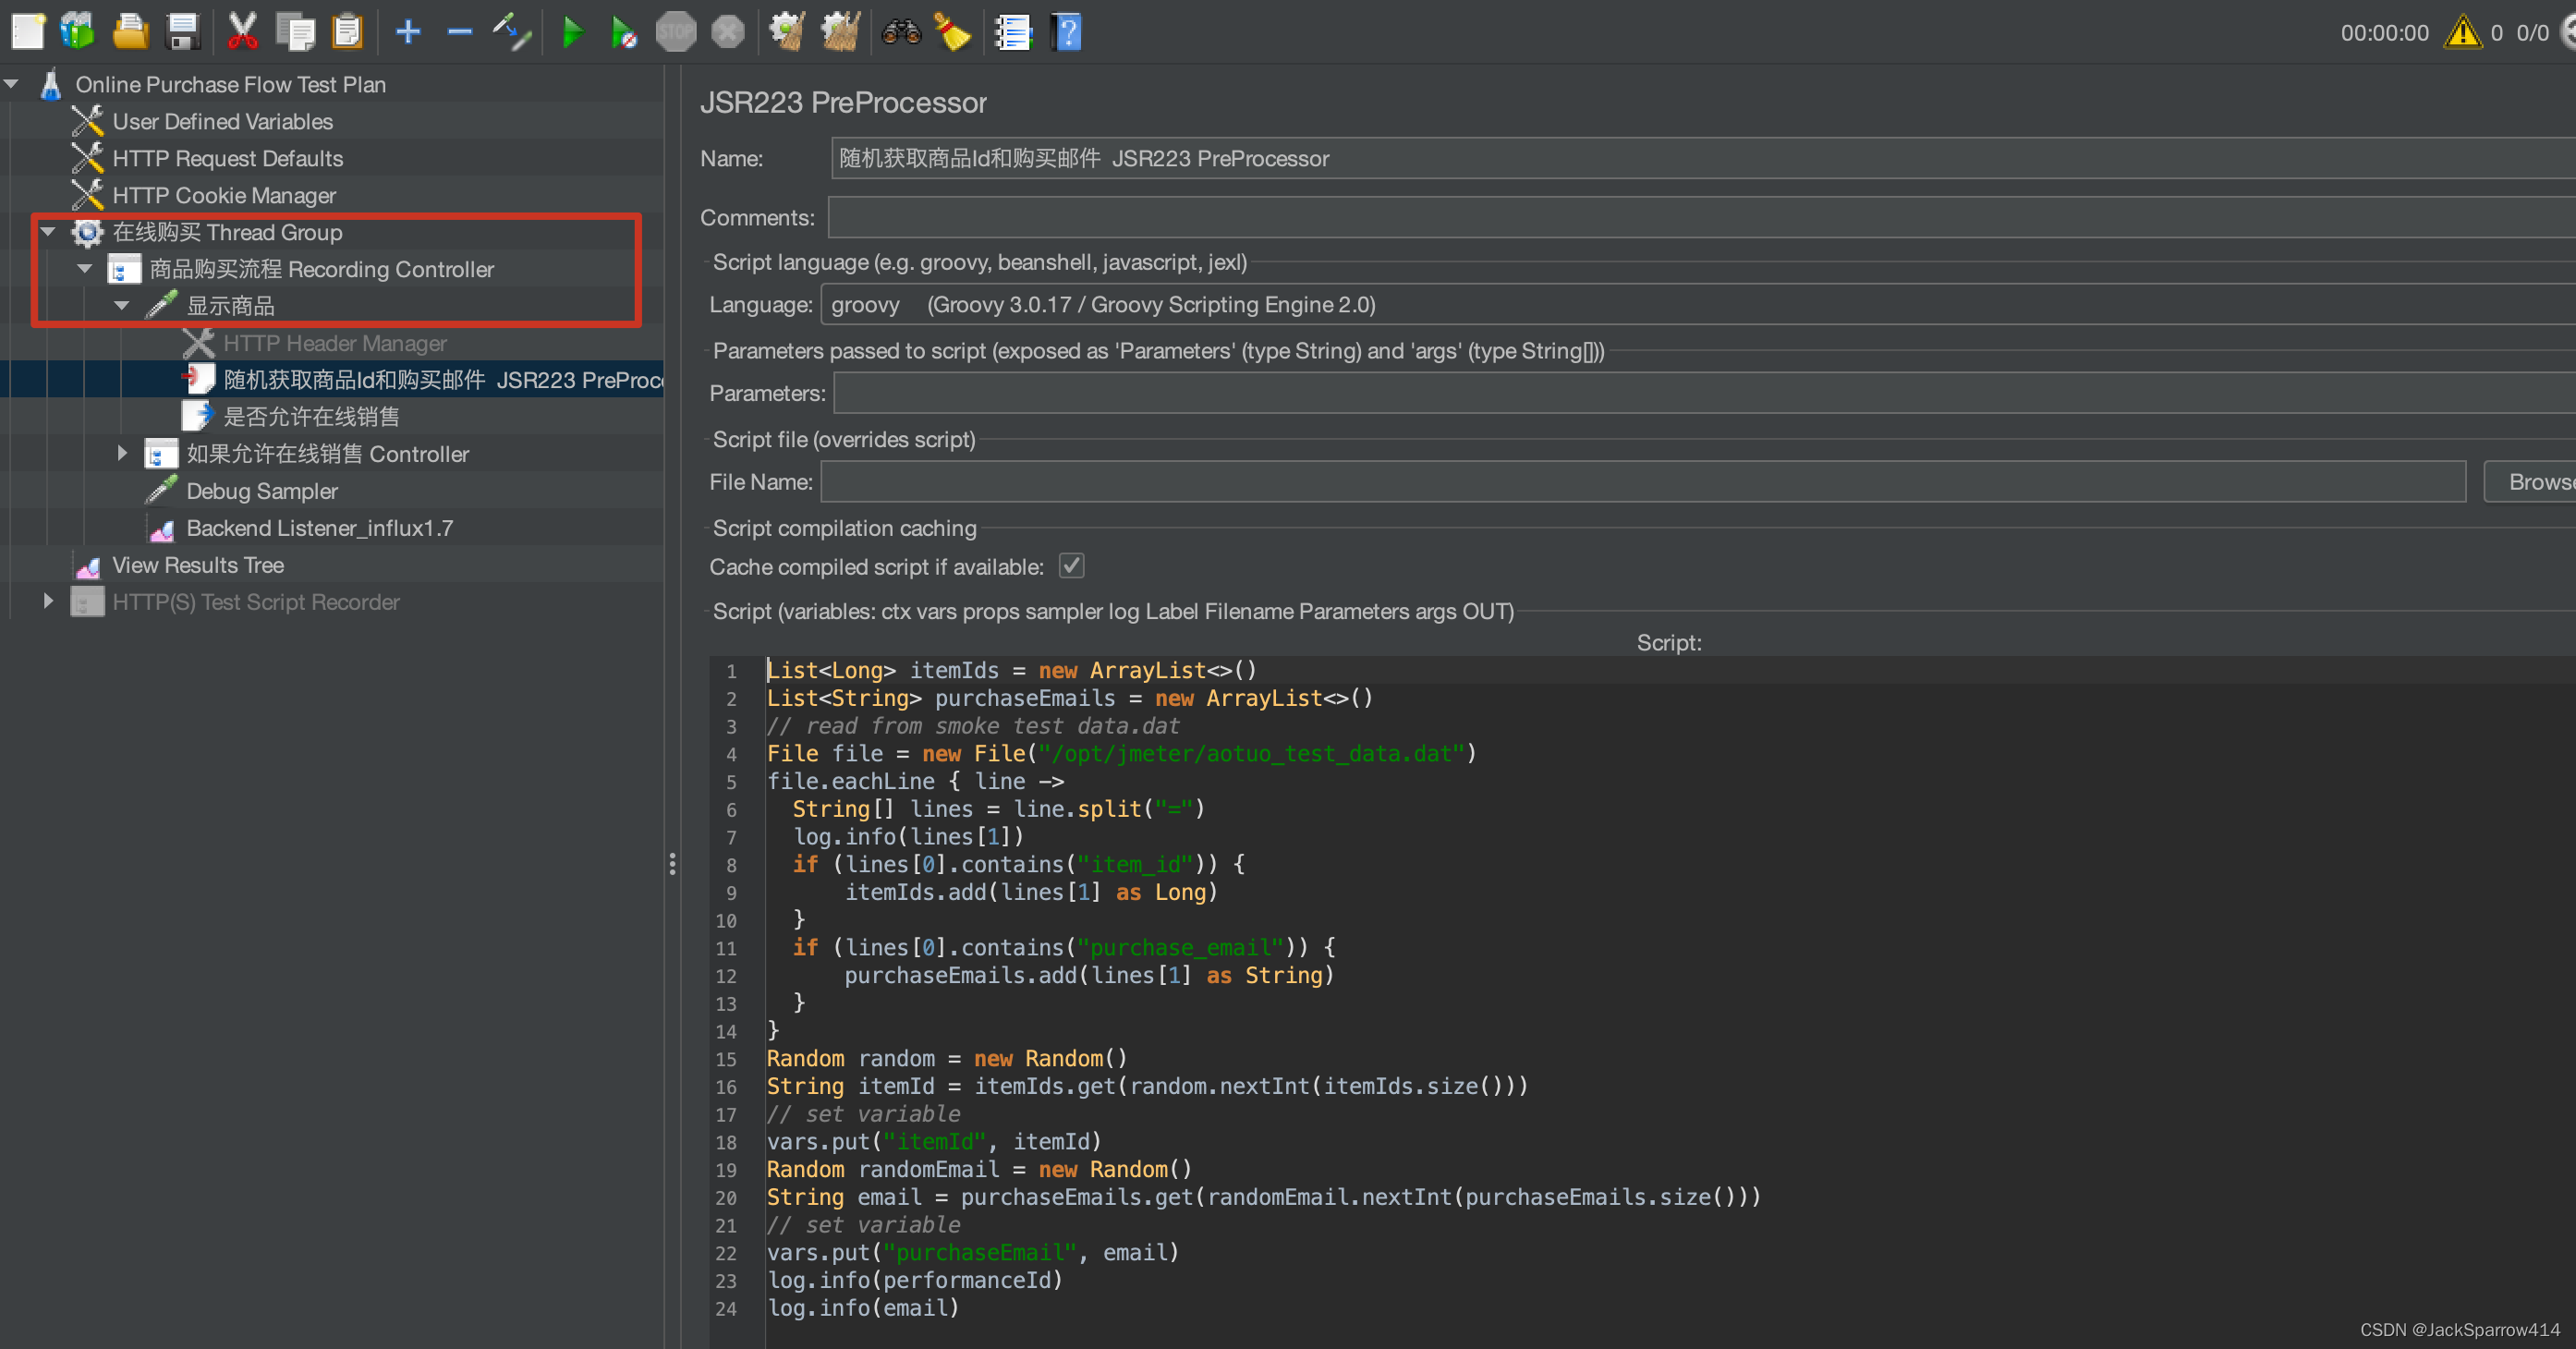 Before the request to the item display API, use Groovy to read the file and randomly obtain an item ID and the email address used for the subsequent purchase, and put them into the corresponding variables through vars.put so they can be read later.
For the methods supported by vars and how to use them, please refer to the Best Practices section of the official JMeter documentation and the Functions section of the user manual
Before the request to the item display API, use Groovy to read the file and randomly obtain an item ID and the email address used for the subsequent purchase, and put them into the corresponding variables through vars.put so they can be read later.
For the methods supported by vars and how to use them, please refer to the Best Practices section of the official JMeter documentation and the Functions section of the user manual
Requesting the API
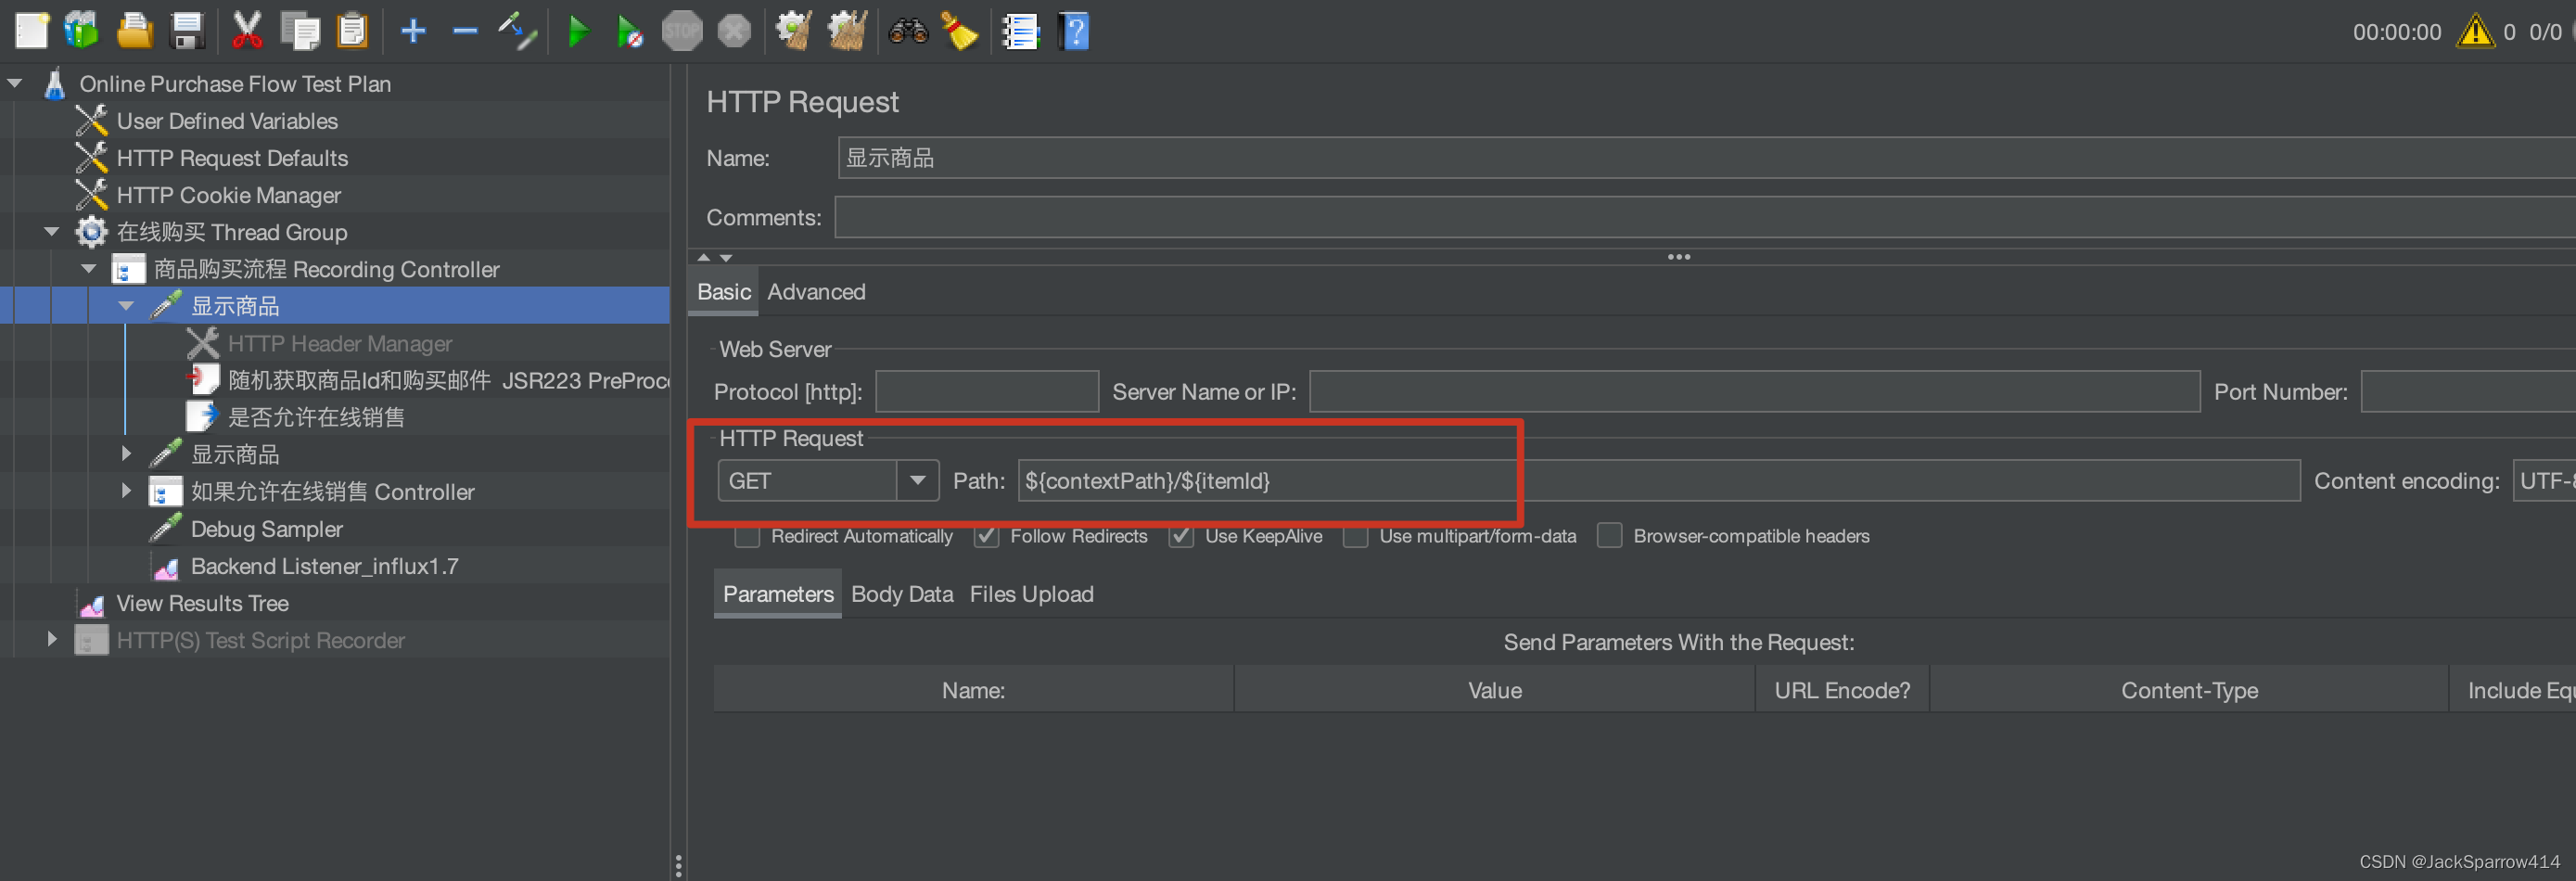 Here we reference the value just set in the PreProcessor through ${itemId}
Using the Regular Expression Extractor Post-Processor to Handle the API Response and Set Variables for the Next API
Since the business flow here is MVC rather than REST, what gets returned is an HTML page, so we use the Regular Expression Extractor post-processor to obtain the elements in the page 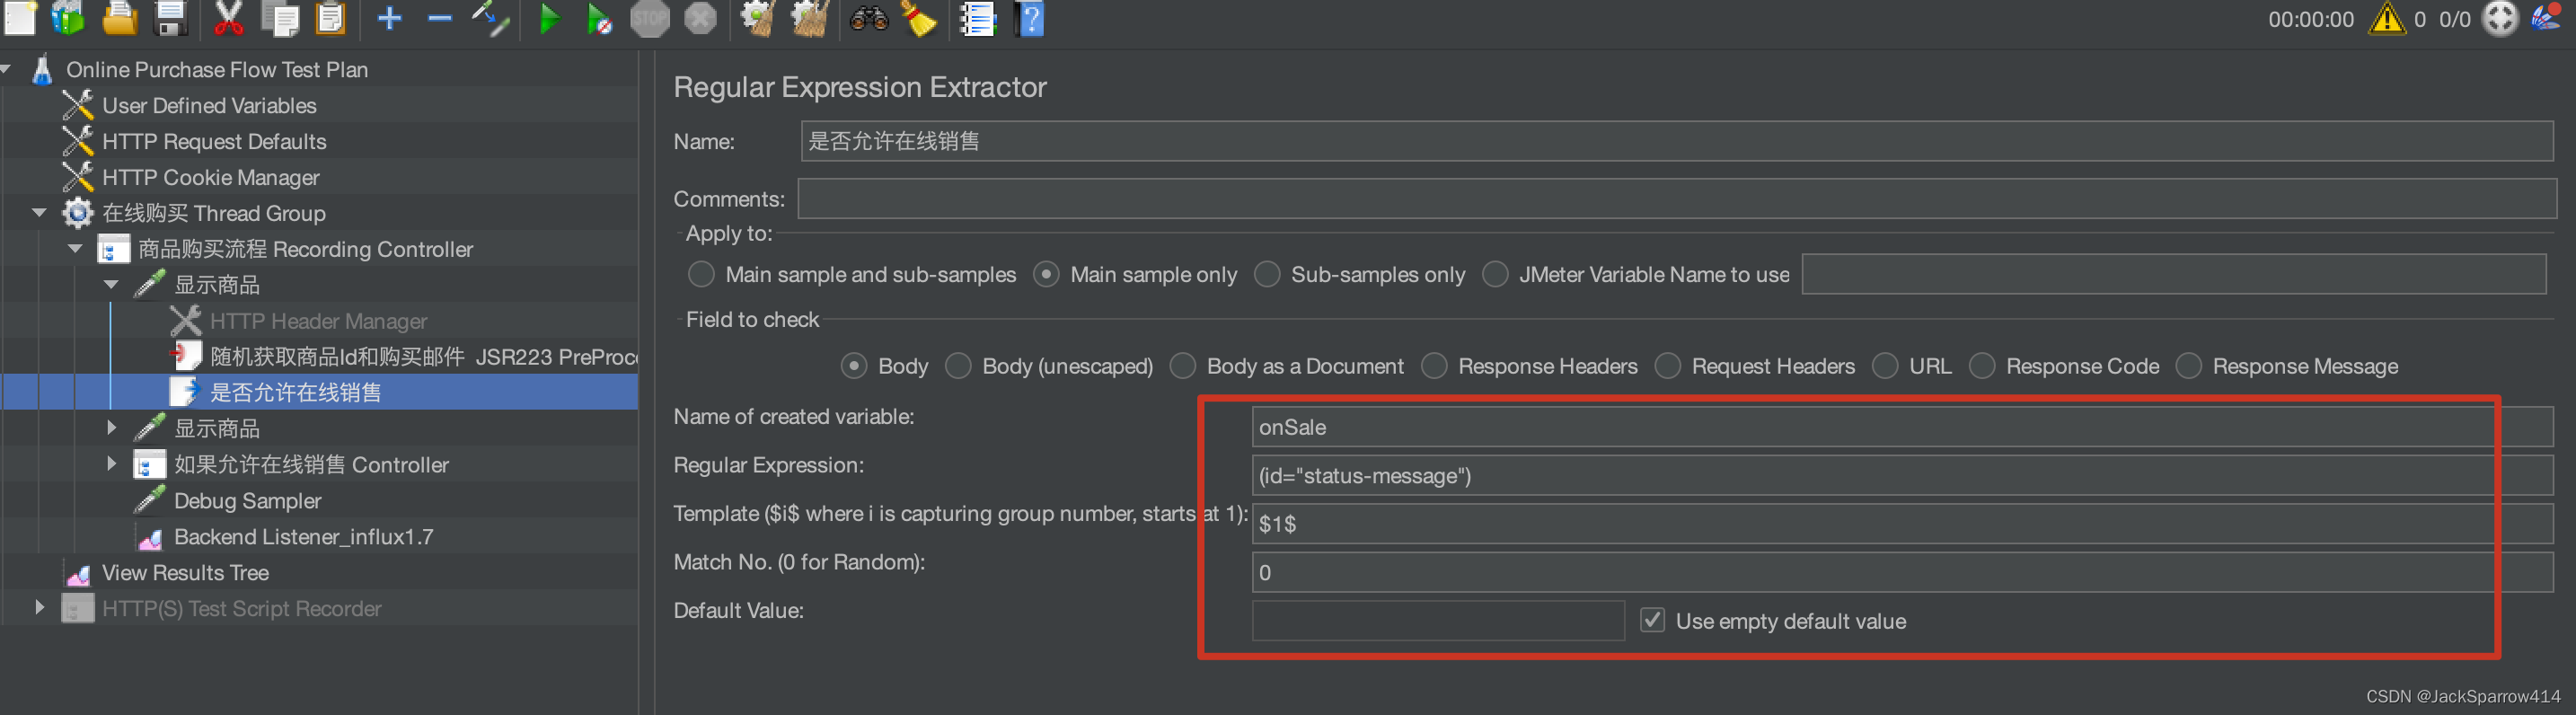 Here we use a regular expression capture group for the page element we want to get, which means using (); $1$ represents the first capture group, and so on.
Match No. (0 for Random) Indicates which match to use. The regular expression may match multiple times
This assigns the result of the regular expression to onSale — just like vars.put — so that subsequent APIs can reference it
Using the Debug Sampler or Debug PostProcessor to Debug the Script
When making the APIs of the entire business line dynamic, my suggestions are:
- Go one API at a time: after modifying one API, verify it, and only continue to the next one when there are no problems.
- If it’s an API in the middle of the flow, then after that API itself is fine, verify it again together with the previously verified APIs in front of it, to make sure the API itself has been made dynamic correctly and that the entire business line up to this API is correct.
- While modifying an API, temporarily Disable the APIs that come after it.
To validate the script: right-click the Thread Group > Validate If there is a problem — for example, a parameter is empty, or a request fails — we need to know whether the data was read correctly and the response data was handled correctly. At that point we need to know what those dynamic parameters actually are while the whole script is running.
The Debug Sampler and the Debug PostProcessor serve similar purposes: both print out the parameters while the script is running. I generally use the Debug Sampler and put it at the very end, as in the screenshots above.
Moving On to the Next API
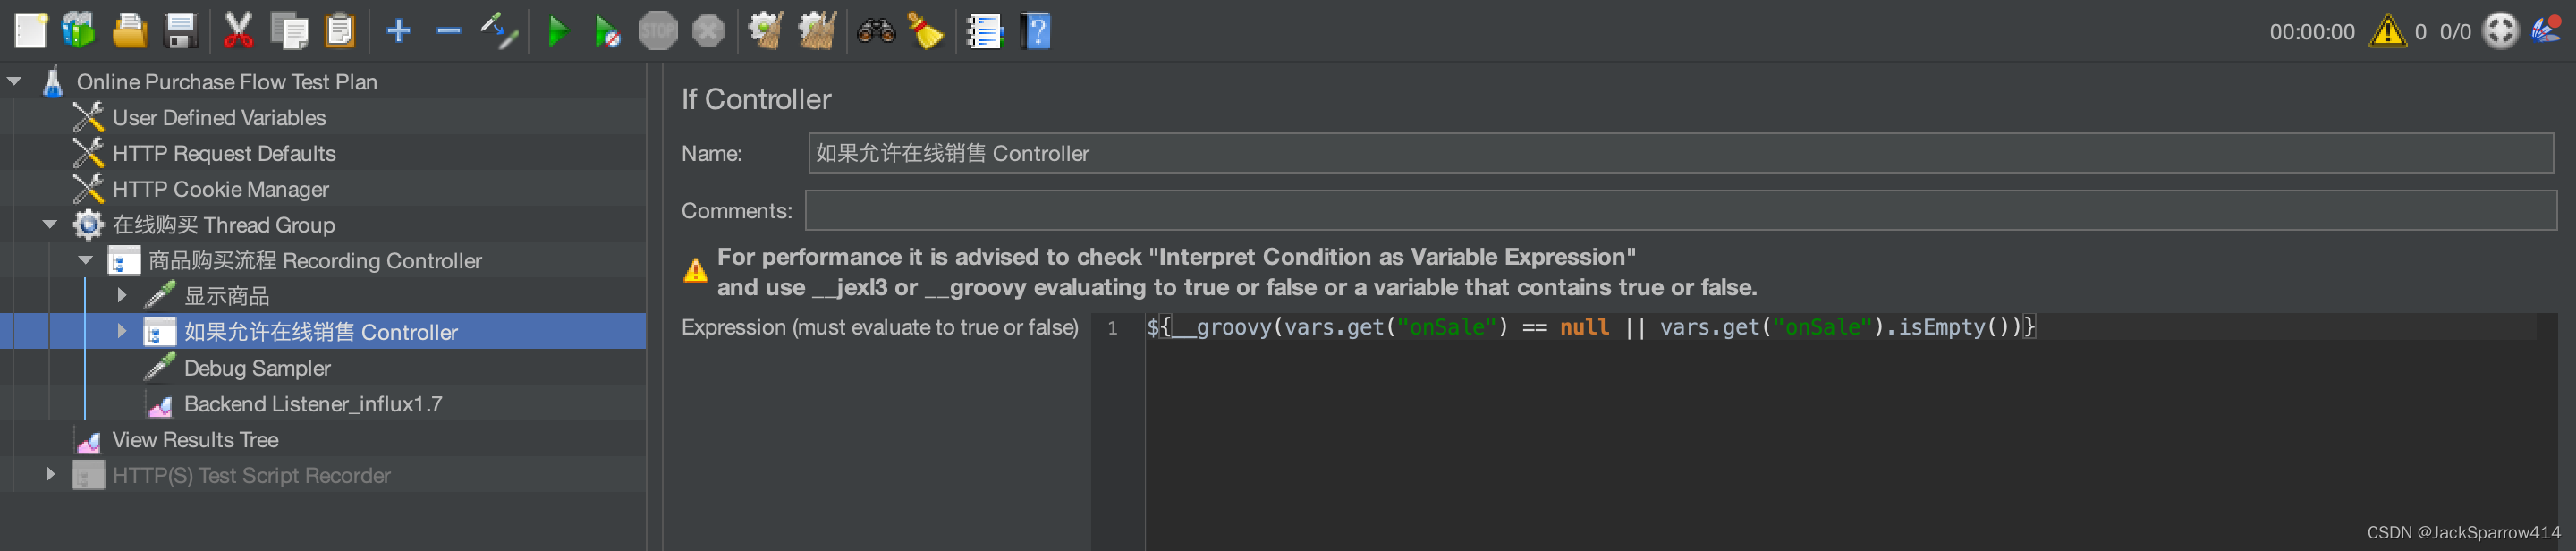 Here we use an If Controller to check whether the onSale set from the previous API’s response is not empty; if it’s not empty, we enter the API inside this controller. Making this API dynamic and verifying it is similar to the above: following the principles described earlier, once this API verifies with no problems, you can move to the next one; when the next one is fine, on to the one after that, until the APIs of the entire business line are all covered. I won’t repeat the details here.
Dynamic Handling When a Form Field Is Submitted with Multiple Values
If the HTML element for each item in the form corresponds to only a single item, then the flow above works without any problems. Sometimes, though, one element of ours may submit multiple items; what a normal HTML form submits looks like
itme_id_1: 1 item_id_2: 2 item_id_3: 3this. How do we handle this case? For example, just use the following script in a Pre Processor
def idPrefix = "item_id_"
for(i in 1..30) {
	var key = idPrefix + i
	def value = vars.get(key)
	if(value){
		sampler.addArgument("item_ids", value)
	} else {
		break
	}
}
For this issue, you can refer to the more detailed answers on stackoverflow
Use CLI Mode for Load Testing in Real Scenarios
After making sure all the scripts are fine, you should use CLI mode rather than GUI mode when running the actual load test
Once everything is ready, you will use CLI mode (Command-line mode previously called Non-GUI mode) to run it for the Load Test
Undoing Certain Changes in JMeter
Generally, when writing a script, before saving you can undo with Command + Z, but after saving you can’t undo anymore. Most of the time that’s not a problem, but in some very special situations, what can you do if you want to undo after saving?
While I was writing scripts, because JMeter can’t open multiple windows, I sometimes had to switch between jmx files frequently. Once, I had already adjusted all the load testing APIs for the entire business line, but at that point I played around with another flow in JMeter using the Test Script Recorder, and then saved… When I realized what had happened, I was dumbstruck — it meant all the previous work had been for nothing… I was scared to death…
After investigating, I found that JMeter luckily has a backup mechanism; by default the maximum number of backup files is 10, and the file path is the backups directory under the JMeter installation path. All of these can be changed, though. It turned out to be quite a scare but nothing more.
Conclusion
This article hasn’t gone into much detail about the various components in JMeter and their concepts. In my opinion, for these basic things, reading the official documentation and configuring a few more scripts yourself is enough to basically know what these components are actually for — the official documentation is already the most essential teaching material, so there’s no need for me to repeat it all here.
I hope readers who want to learn JMeter will read the official documentation more; when you run into a concept that’s unclear or a configuration that’s unclear, just follow the documentation to track it down. Readers who are just getting started are advised to read the FAQ and Best Practices sections more.
The next article will introduce how to pair a Jenkins Job with JMeter to achieve semi-automated load testing, how to use Grafana to visualize the load test results, and how to use other tools to analyze whether there are performance bottlenecks during the load test.