Table of contents
Open Table of contents
Kafka Terminology
For commonly used Kafka terminology, see Confluent’s documentation. I will not repeat it here.
Choose a Kafka Image
The Official Kafka Image
Update: 2024-05-14. Kafka introduced an official Docker image in 3.7.0. For usage and examples, see the Docker section of the official documentation.
There was no official image when I wrote this post, so the rest of the article uses a community image from Docker Hub.
Community Images on Docker Hub
I chose the widely used Bitnami Kafka image. The main point to understand is how its environment variables map to Kafka configuration.
Additionally, any environment variable beginning with KAFKA_CFG_ will be mapped to its corresponding Apache Kafka key. For example, use KAFKA_CFG_BACKGROUND_THREADS in order to set background.threads or KAFKA_CFG_AUTO_CREATE_TOPICS_ENABLE in order to configure auto.create.topics.enable
For any Bitnami image, if you encounter a problem and want more detailed logs, enable debug logging through the environment variable
BITNAMI_DEBUG=trueshown above.
Because Docker Hub limits documentation length, see the complete documentation on GitHub.
Choose a Kafka UI Image
I did not investigate Kafka UI tools extensively. At this early stage, I did not yet know our monitoring and management pain points, so I wanted to start using one first.
The official Kafka UI repository > documentation website > Compose examples contains many Compose configurations. They are useful both for configuring the UI and for learning Kafka, including a KRaft-mode Kafka cluster.
Consult the official documentation for other settings.
Docker Compose File
version: "3"
services:
  kafka:
    image: "bitnami/kafka:latest"
    container_name: kafka
    ports:
      - "9092:9092"
      - "9093:9093"
      - "9998:9998"
      - "9095:9095"
    volumes:
      - type: volume
        source: kafka_standalone_data
        target: /bitnami/kafka
        read_only: false
      - type: bind
        source: ./jmx_prometheus_javaagent-1.0.1.jar
        target: /opt/bitnami/kafka/config/jmx_prometheus_javaagent-1.0.1.jar
        read_only: true
      - type: bind
        source: ./kafka-kraft-3_0_0.yml
        target: /opt/bitnami/kafka/config/kafka-kraft-3_0_0.yml
        read_only: true
    environment:
      - BITNAMI_DEBUG=yes
      # Kafka JVM configuration
      - KAFKA_HEAP_OPTS=-Xmx2048m -Xms2048m
      # The following three properties are required to enable KRaft mode
      - KAFKA_CFG_NODE_ID=1
      - KAFKA_CFG_PROCESS_ROLES=broker,controller
      - KAFKA_CFG_CONTROLLER_LISTENER_NAMES=CONTROLLER
      # broker id
      - KAFKA_BROKER_ID=1
      # Listener configuration
      - KAFKA_CFG_LISTENERS=CONTROLLER://:9094,BROKER://:9092,EXTERNAL://:9093
      - KAFKA_CFG_LISTENER_SECURITY_PROTOCOL_MAP=CONTROLLER:PLAINTEXT,BROKER:PLAINTEXT,EXTERNAL:PLAINTEXT
      # EXTERNAL uses the Docker host’s address; BROKER can use Docker’s internal network address
      - KAFKA_CFG_ADVERTISED_LISTENERS=BROKER://kafka:9092,EXTERNAL://192.168.0.101:9093
      # Listener for communication between brokers
      - KAFKA_CFG_INTER_BROKER_LISTENER_NAME=BROKER
      # Controller servers used for elections; list all controllers if there are several. Here, use the local instance
      - KAFKA_CFG_CONTROLLER_QUORUM_VOTERS=1@127.0.0.1:9094
      - ALLOW_PLAINTEXT_LISTENER=yes
      # Enable JMX monitoring
      - JMX_PORT=9998
      - KAFKA_JMX_OPTS=-Dcom.sun.management.jmxremote -Dcom.sun.management.jmxremote.authenticate=false -Dcom.sun.management.jmxremote.ssl=false -Djava.rmi.server.hostname=kafka -Dcom.sun.management.jmxremote.rmi.port=9998
      # Integrate Prometheus JMX Exporter
      - KAFKA_OPTS=-javaagent:/opt/bitnami/kafka/config/jmx_prometheus_javaagent-1.0.1.jar=9095:/opt/bitnami/kafka/config/kafka-kraft-3_0_0.yml
    deploy:
      resources:
        limits:
          memory: 4G
    memswap_limit: -1
  kafka-ui:
    container_name: kafka-ui
    image: provectuslabs/kafka-ui:latest
    ports:
      - "9095:8080"
    depends_on:
      - kafka
    environment:
      KAFKA_CLUSTERS_0_NAME: kafka-stand-alone
      KAFKA_CLUSTERS_0_BOOTSTRAPSERVERS: kafka:9092
      KAFKA_CLUSTERS_0_METRICS_PORT: 9998
      SERVER_SERVLET_CONTEXT_PATH: /kafkaui
      AUTH_TYPE: "LOGIN_FORM"
      SPRING_SECURITY_USER_NAME: admin
      SPRING_SECURITY_USER_PASSWORD: kafkauipassword
      DYNAMIC_CONFIG_ENABLED: "true"
volumes:
  kafka_standalone_data:
    driver: local
Kafka Configuration Explained
KRaft vs Zookeeper
We use KRaft because Kafka has plans to remove ZooKeeper. Confluent has published many articles explaining why; a Google search will find plenty, so I will not list them all.
KRaft site:confluent.ioHere are a few articles:
- why move to kraft
- Why ZooKeeper Was Replaced with KRaft
- Apache Kafka Without ZooKeeper
- Getting Started with the KRaft Protocol
KRaft Settings
- node.id
The node ID associated with the roles this process is playing when
process.rolesis non-empty. This is required configuration when running in KRaft mode. - porcess.roles
The roles that this process plays: ‘broker’, ‘controller’, or ‘broker,controller’ if it is both. This configuration is only applicable for clusters in KRaft (Kafka Raft) mode (instead of ZooKeeper). Leave this config undefined or empty for Zookeeper clusters
- controller.listener.names
A comma-separated list of the names of the listeners used by the controller. This is required if running in KRaft mode
Controllers and Brokers
In brief:
A controller coordinates brokers. For details, see Chapter 5 of Kafka: The Definitive Guide, available for free through Apache Kafka’s website > Get Started > Books.
To summarize, Kafka uses Zookeeper’s ephemeral node feature to elect a controller and to notify the controller when nodes join and leave the cluster. The controller is responsible for electing leaders among the partitions and replicas whenever it notices nodes join and leave the cluster. The controller uses the epoch number to prevent a “split brain” scenario where two nodes believe each is the current controller.
A broker handles producer requests, stores messages, and serves consumer requests.
A single Kafka server is called a broker. The broker receives messages from producers, assigns offsets to them, and commits the messages to storage on disk. It also services consumers, responding to fetch requests for partitions and responding with the mes‐ sages that have been committed to disk From Kafka: The Definitive Guide, Chapter 1 > Enter Kafka > Brokers and Clusters:
Listener Configuration
This section of the official documentation confused me until I read Kafka Listeners Explained. I strongly recommend reading it.
Listeners fall into three categories:
- Controller-election listeners.
- Listeners for communication between brokers within the cluster.
- Listeners for external clients, such as Java clients connecting to Kafka.
Once you understand these three listener types, the article above and Apache Kafka’s configuration reference make listener configuration much easier.
JVM Settings and Resource Limits
resources.limits.memory allows the Kafka container to use 4 GB in total. KAFKA_HEAP_OPTS assigns 2 GB to the Kafka JVM, leaving another 2 GB for caching or other purposes. memswap_limit: -1 allows swap when memory is insufficient.
Problems Caused by Poor Configuration
In production, the host running our Kafka container frequently raised CPU alerts. Grafana showed swap usage increasing markedly during those periods. Both the JVM memory and resources.limits.memory were set to 2 GB, leaving no other memory for caching and causing frequent swapping. We corrected the settings as above. Use docker update to make the change without stopping the container.
docker update --memory 4g --memory-swap -1 kafkaIntegrate Prometheus JMX Exporter
See Kafka’s overall monitoring recommendations and Datadog’s Kafka monitoring recommendations. Relevant chapters of Kafka: The Definitive Guide can also help you choose metrics.
Kafka Server
Follow the Prometheus JMX Exporter documentation to integrate it. kafka-kraft-3_0_0.yml comes from the official repository’s example_configs directory.
After startup, access the endpoint. Seeing metric data indicates that it works.
This article provides an example; adapt the configuration to your actual needs.
Producer
Producers are often our web applications. Use jmx_exporter for those applications too, with a configuration containing only the producer metrics.
After starting the application, use JConsole to check that the producer metrics are available.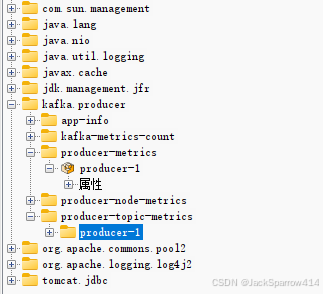
Consumer
Consumers may also run in other web applications. Use jmx_exporter with a configuration containing the consumer metrics.
Kafka UI Configuration Explained
Set METRICS_PORT in the UI configuration to Kafka’s JMX_PORT. If you know how JMX works, the reason should be clear; otherwise, see Getting started with JMX.
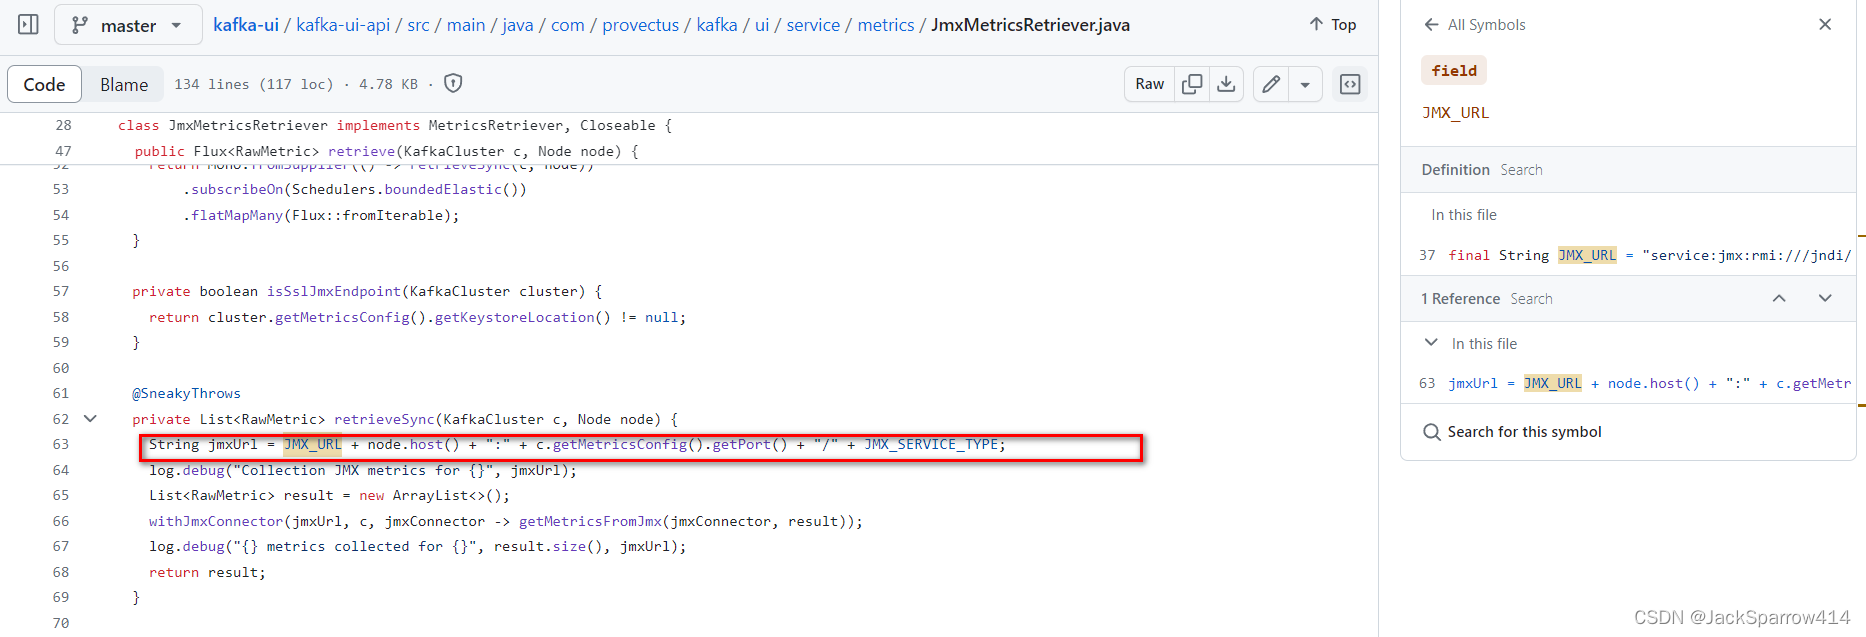
You may notice that reaching another Compose service normally uses container_service_host_name:port, as explained in Docker Compose networking, while this setting contains only a port. How does Kafka UI construct the JMX URL? I checked its source and found that it can obtain the host, so there is no need to worry about this.
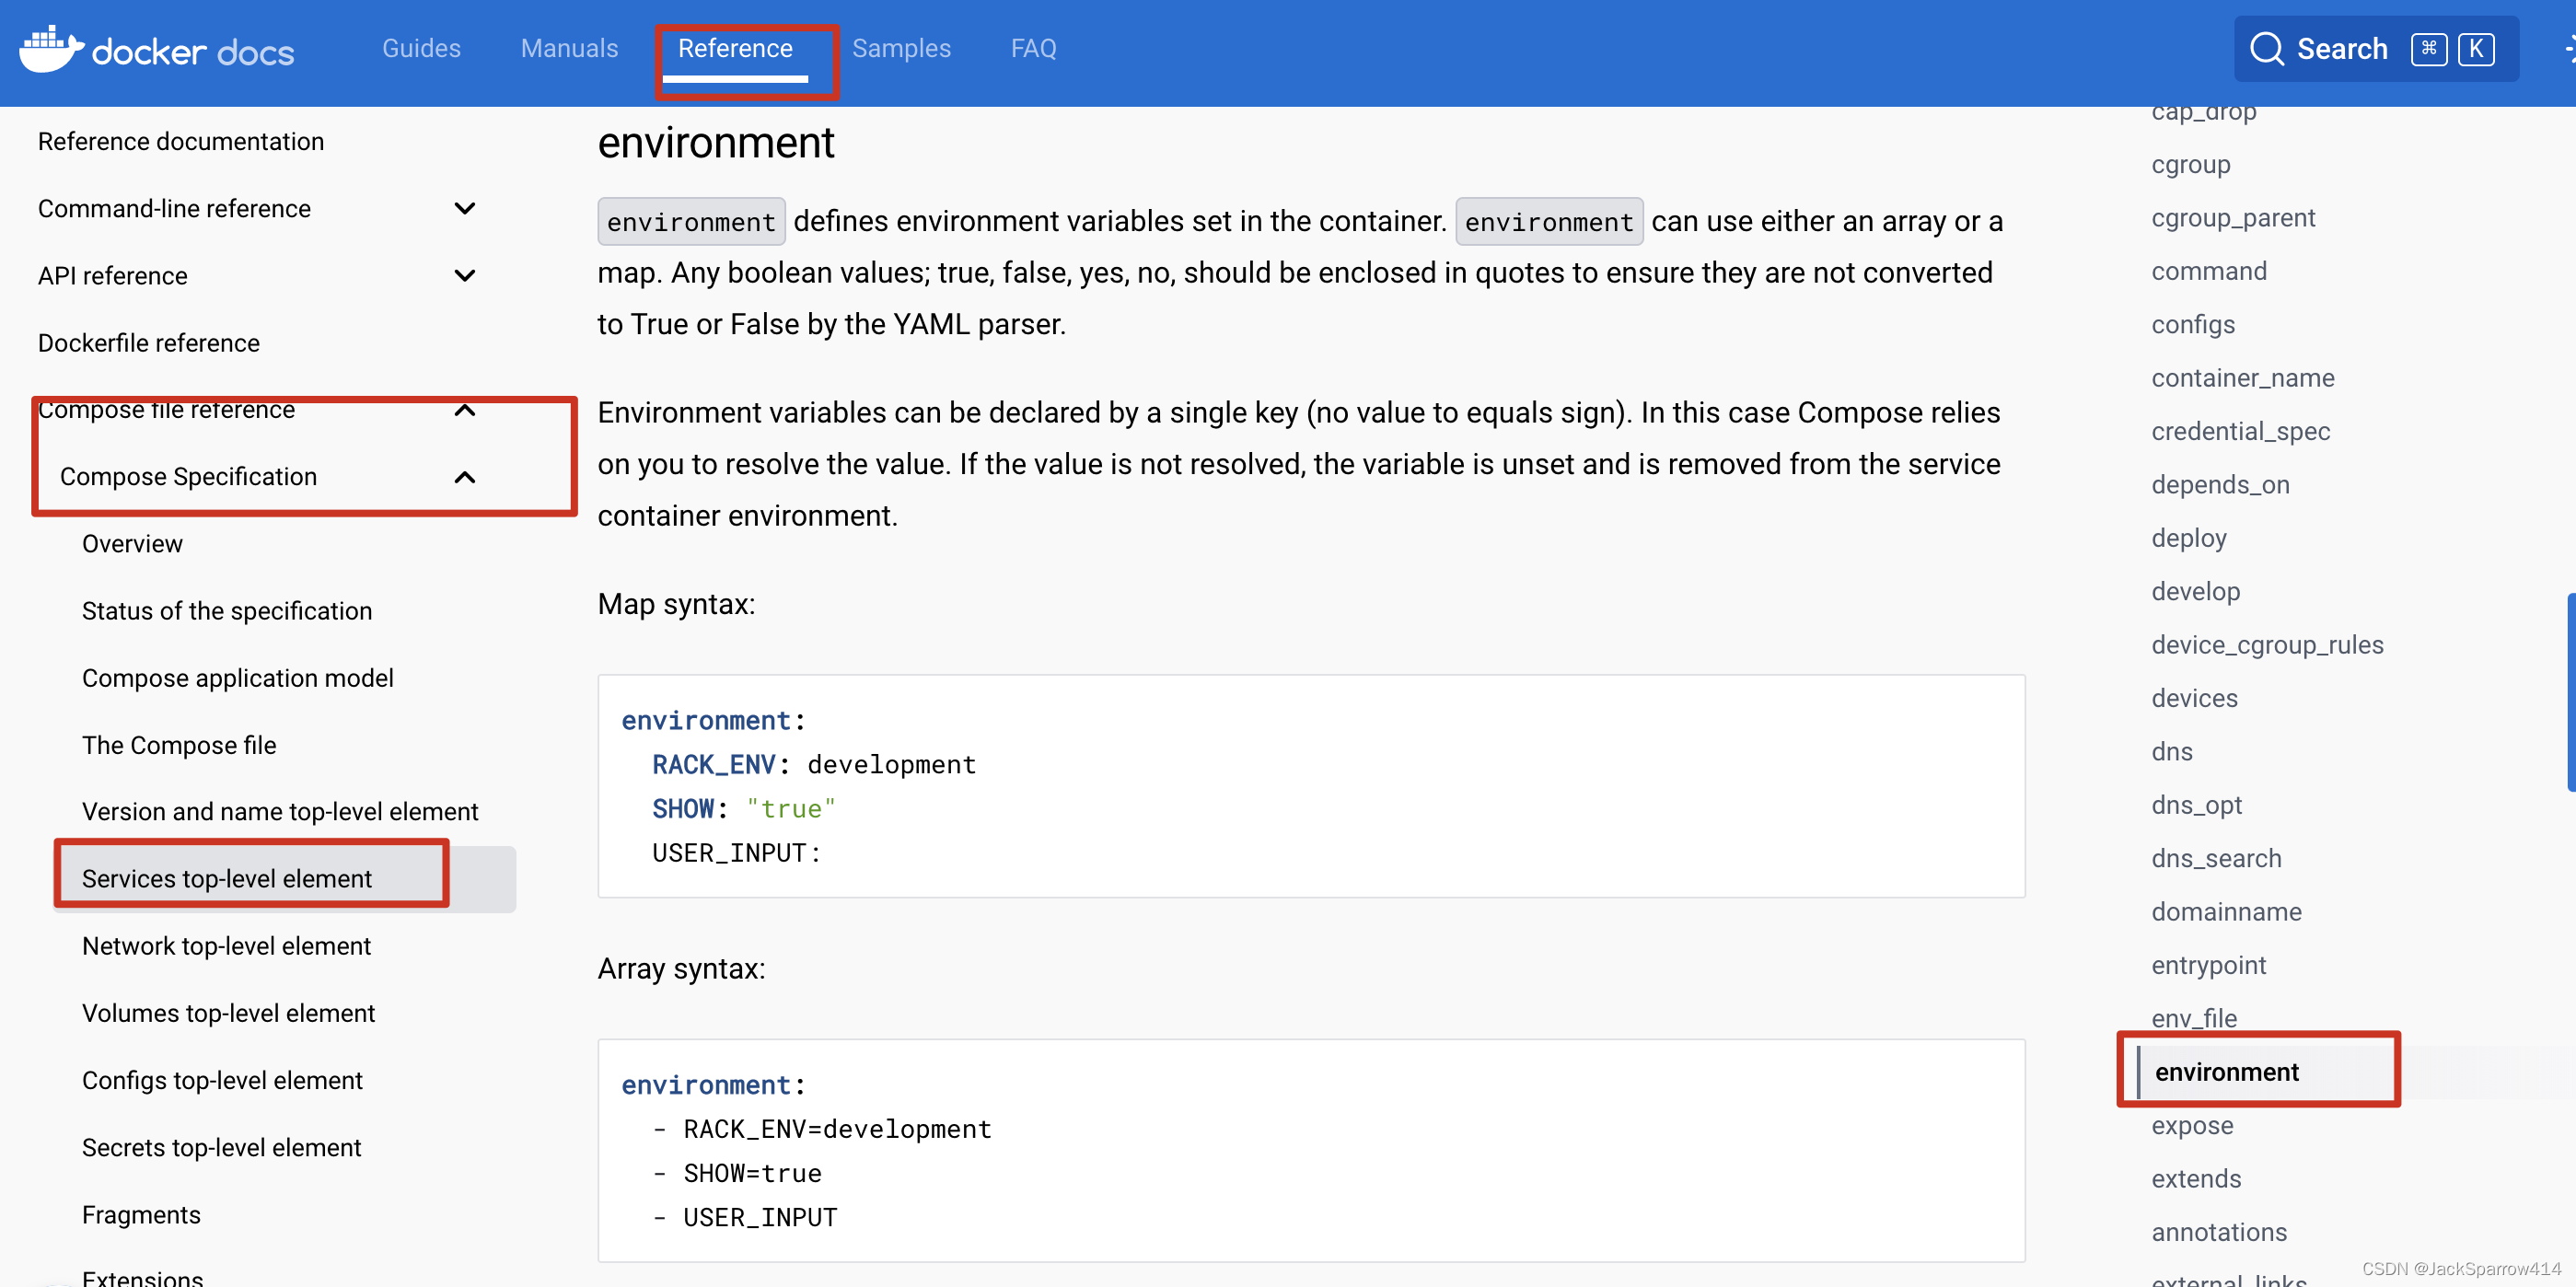
There is little else to add about the UI settings. Note that environment in its docker-compose.yml uses a different syntax from the Kafka image configuration above. Both forms are valid.
See the environment section of the Compose specification.
Testing
Start the environment using the docker-compose.yml above.
docker-compose -f docker-compose.yml up -dOpen the following address in a local browser:
http://localhost:9095/kafkaui/authEnter the username and password to access the UI.
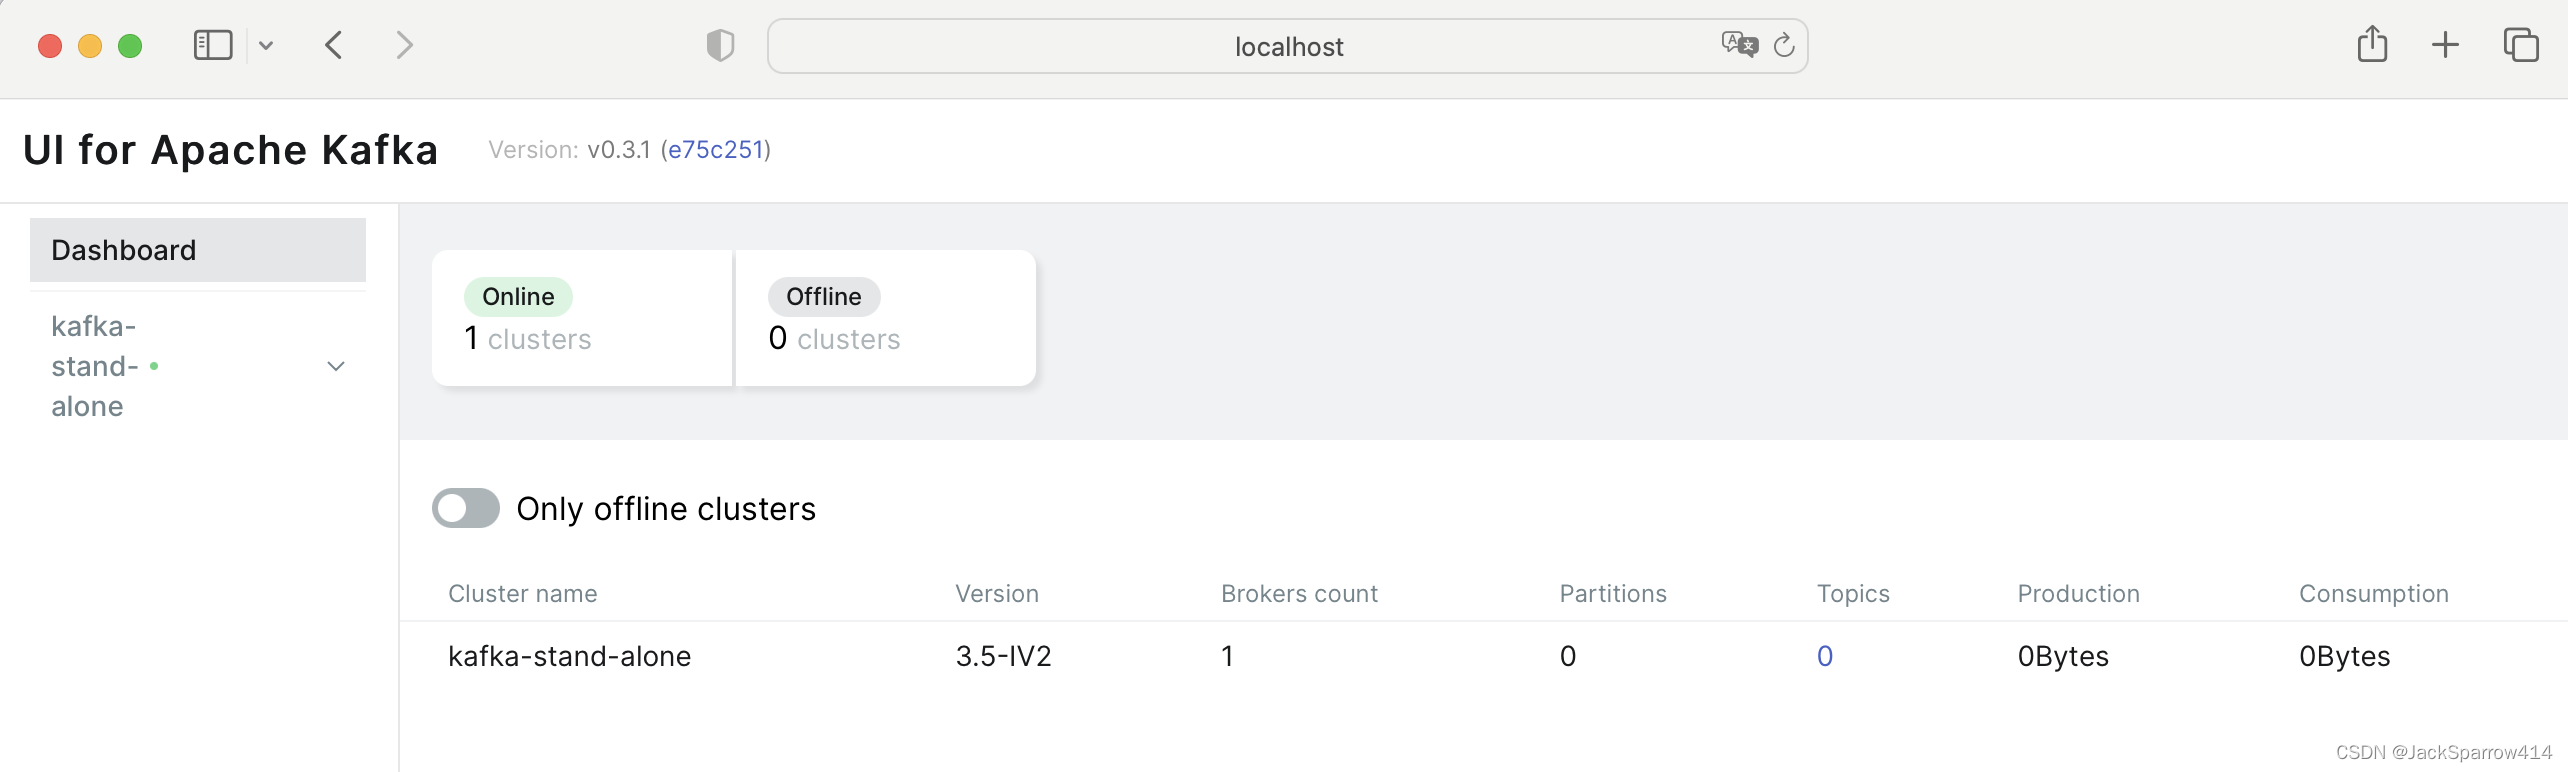 Access:
http://localhost:9095/metricsThe metrics should appear.
Kafka Commands Fail with “Address Already in Use” After Enabling JMX or Prometheus
For the reason, see Why do Kafka tools fail when JMX is enabled?.
Solutions
- When using exec from outside the container, set JMX_PORT and KAFKA_OPTS for the command.
docker exec -e JMX_PORT= -e KAFKA_OPTS= kafka /opt/bitnami/kafka/bin/kafka-topics.sh --bootstrap-server localhost:9092 --create --if-not-exists --topic test-topic --partitions 20 --replication-factor 1 --config min.insync.replicas=1 --config retention.bytes=1073741824 - Inside the container, unset them before executing the command.
# Enter the container docker exec -it kafka bash # First execute these two commands inside the container unset JMX_PORT unset KAFKA_OPTS # Run the specific command - Use a separate container to run the request. See this answer.
Kafka Clusters
This post focuses on a single-node Kafka environment. Clustering is outside its scope, but the following example repositories may help if you need a cluster. All use KRaft rather than ZooKeeper.
How Many Nodes Does a Basic Highly Available Kafka Cluster Need?
My understanding is that the smallest cluster should have three controllers and three brokers. Why three brokers? The replication section of Kafka’s documentation says:
With this ISR model and f+1 replicas, a Kafka topic can tolerate f failures without losing committed messages
This means that with a topic replication factor of 2, Kafka can continue operating when one node fails. The factor includes the leader: “The total number of replicas including the leader constitute the replication factor.” Kafka’s algorithm differs from those used by ZooKeeper and Elasticsearch clusters. With only two nodes, ZooKeeper and Elasticsearch would not work in that situation.
The downside of majority vote is that it doesn’t take many failures to leave you with no electable leaders. To tolerate one failure requires three copies of the data, and to tolerate two failures requires five copies of the data. In our experience having only enough redundancy to tolerate a single failure is not enough for a practical system, but doing every write five times, with 5x the disk space requirements and 1/5th the throughput, is not very practical for large volume data problems. This is likely why quorum algorithms more commonly appear for shared cluster configuration such as ZooKeeper but are less common for primary data storage
That seems to suggest Kafka needs only two nodes. Why use three? I searched Stack Overflow and found that someone had asked exactly this question.
- With replication factor 2 and min.insync.replicas 2, producers cannot write after one node fails.
- With replication factor 2 and min.insync.replicas 1, a follower may not have the message when the leader fails.
- With replication factor 3 and min.insync.replicas 2, producers can still write after one node fails.
- With replication factor 3 and min.insync.replicas 2, at least one follower remains synchronized with the leader when the leader fails, allowing a new leader to take over.
Example Kafka Cluster Configurations
Kafka’s KRaft controller deployment recommendations.
- Update: 2024-05-14. Version 3.7.0 introduced the official image and many examples. See the official repository for cluster examples.
- Bitnami’s cluster example, with three nodes, each acting as both controller and broker.
- Confluent’s cluster configuration. I prefer this configuration because Confluent commercializes Kafka and its founders came from LinkedIn. It has four nodes: one controller and three brokers.
- Kafka-in-a-Box, with four nodes.
Kafka vs. RabbitMQ vs. Pulsar Performance
See Confluent’s article.
Resources
Source code for this article and the rest of the series is on GitHub. Feel free to use it.