Table of contents
Open Table of contents
Background and Choosing an Approach
I have recently been working on our company’s logging system. At this stage, it has two main parts:
- Tomcat’s catalina.out
- Tomcat’s access_log
All our servers run on AWS, and both types of logs need to reach an ELK environment deployed with Docker. For the first part, Log4j2 can send application logs to ELK in real time. See Sending ECS-formatted logs to Logstash with Log4j2. For the second, the approach is to collect Tomcat access_log files from the EC2 instances through AWS CloudWatch Logs, have Filebeat pull the collected logs, and send them to ELK.
Note: AWS CloudWatch is a broad service that collects both metrics and logs. See the official CloudWatch documentation for details.
Prerequisites
Register an AWS Account
After registration, AWS provides a free tier for one year.
Create an EC2 Instance
Find the EC2 documentation in the EC2 console.
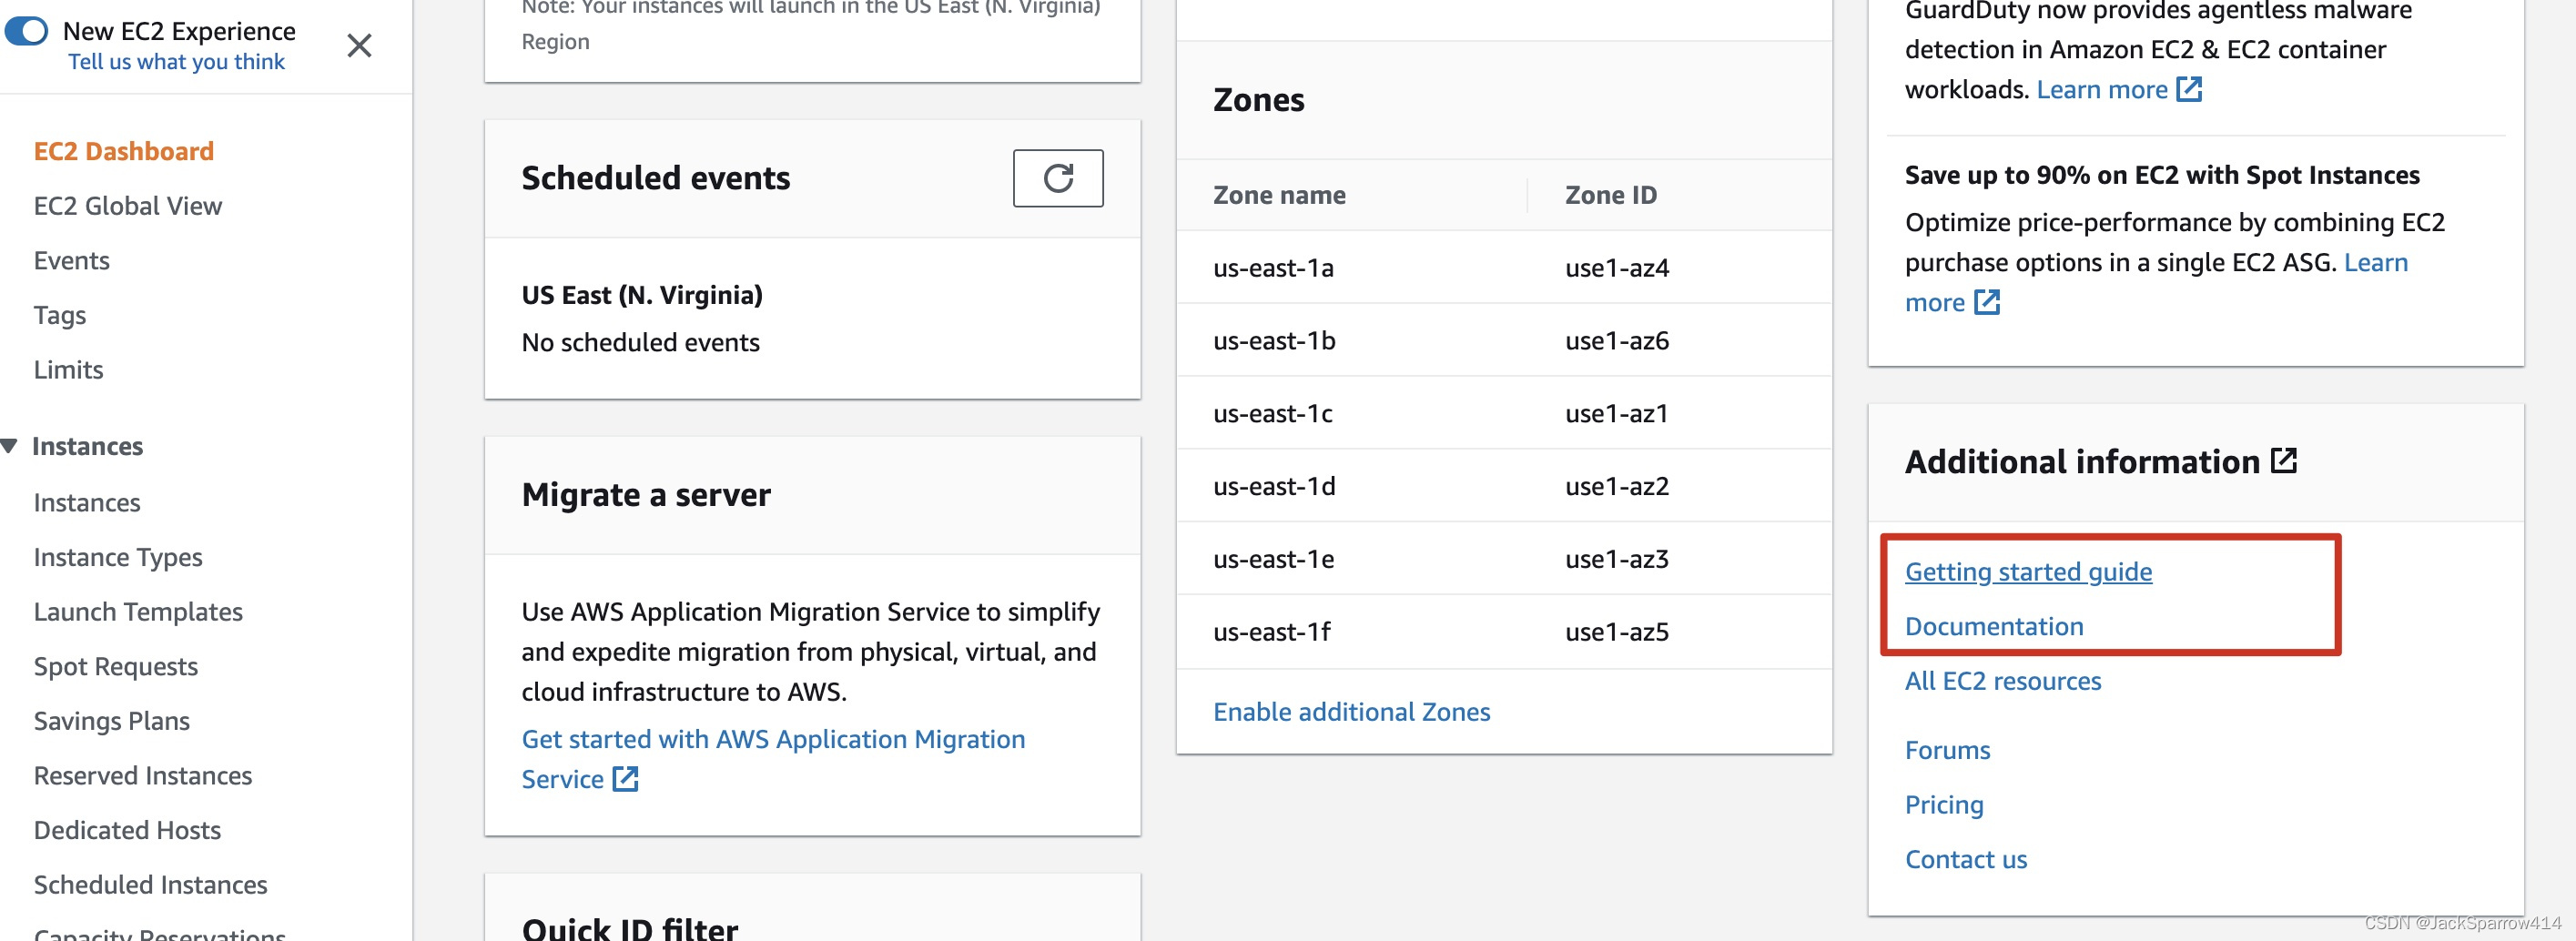 Follow the official documentation to launch an instance.
Points to Check
- Create a key pair in advance, or check that one already exists.
- Create a VPC in advance. Check whether a default VPC exists; if not, choose Create Default VPC.

- Create a security group in advance, or check that one exists. Pay particular attention to the HTTP, HTTPS, and SSH ports exposed by its inbound rules; otherwise, you may be unable to connect through the EC2 console.
- Once all three are in place, create the EC2 instance following the official documentation, then test connectivity through the EC2 console.
- After connecting, check IAM for a user named ec2-user, since that is the default EC2 instance username. If it does not exist, create one for this instance. See the following documentation for the detailed steps.
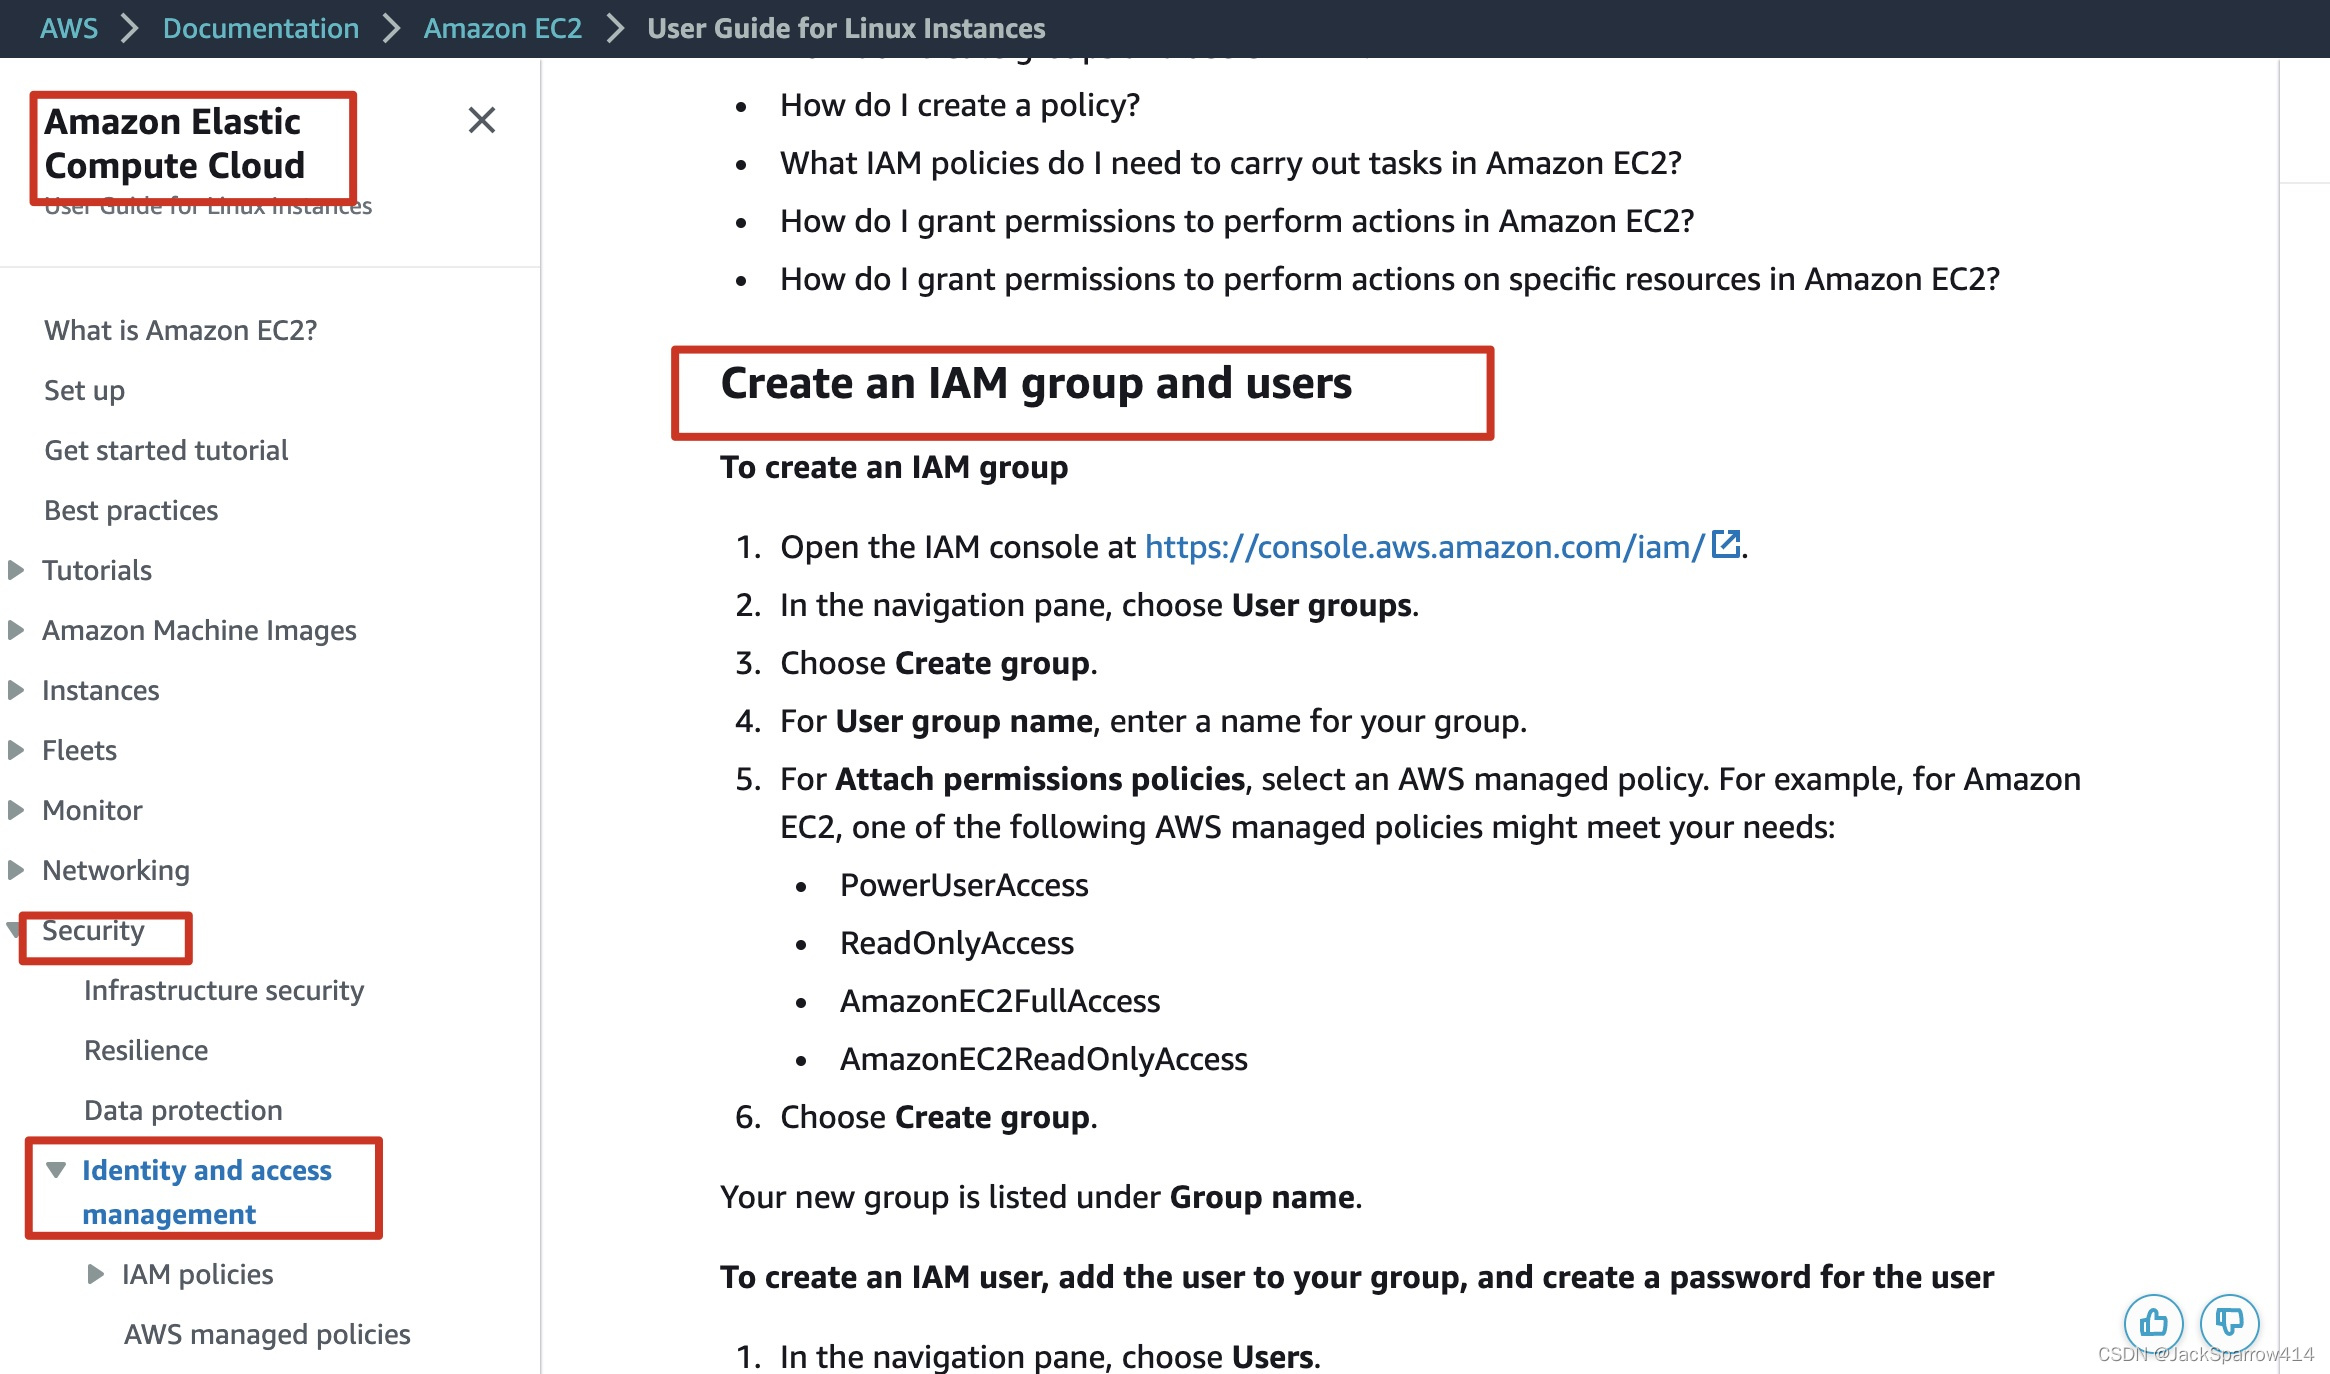 After creating the user, save its access key and secret key.
Install aws-cloudwatch-agent on the EC2 Instance
Follow the official documentation step by step.
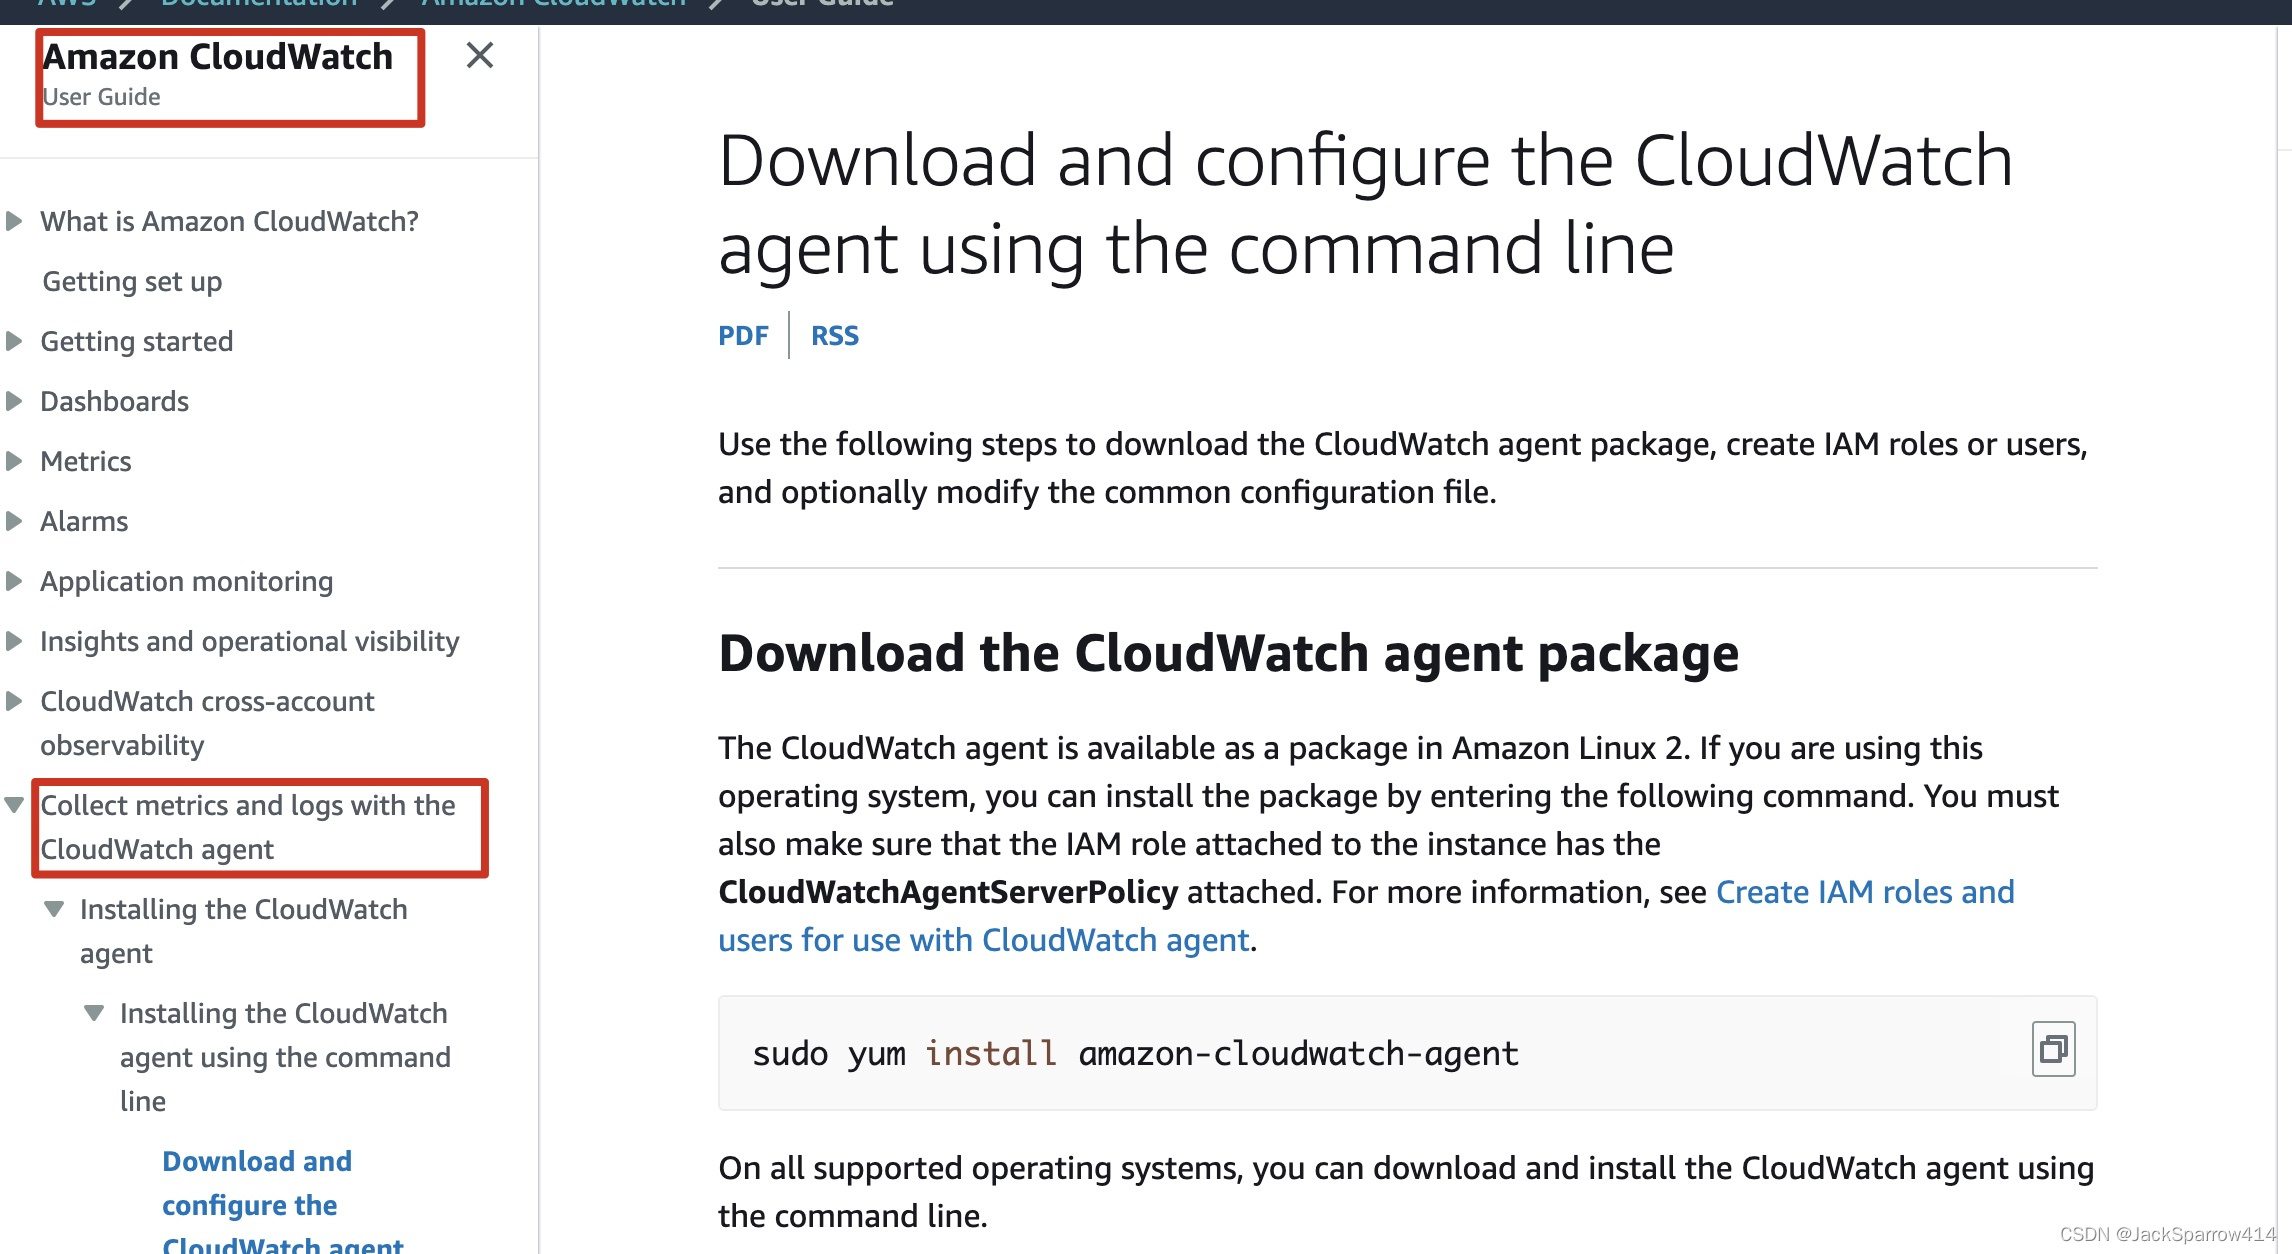
Points to Check
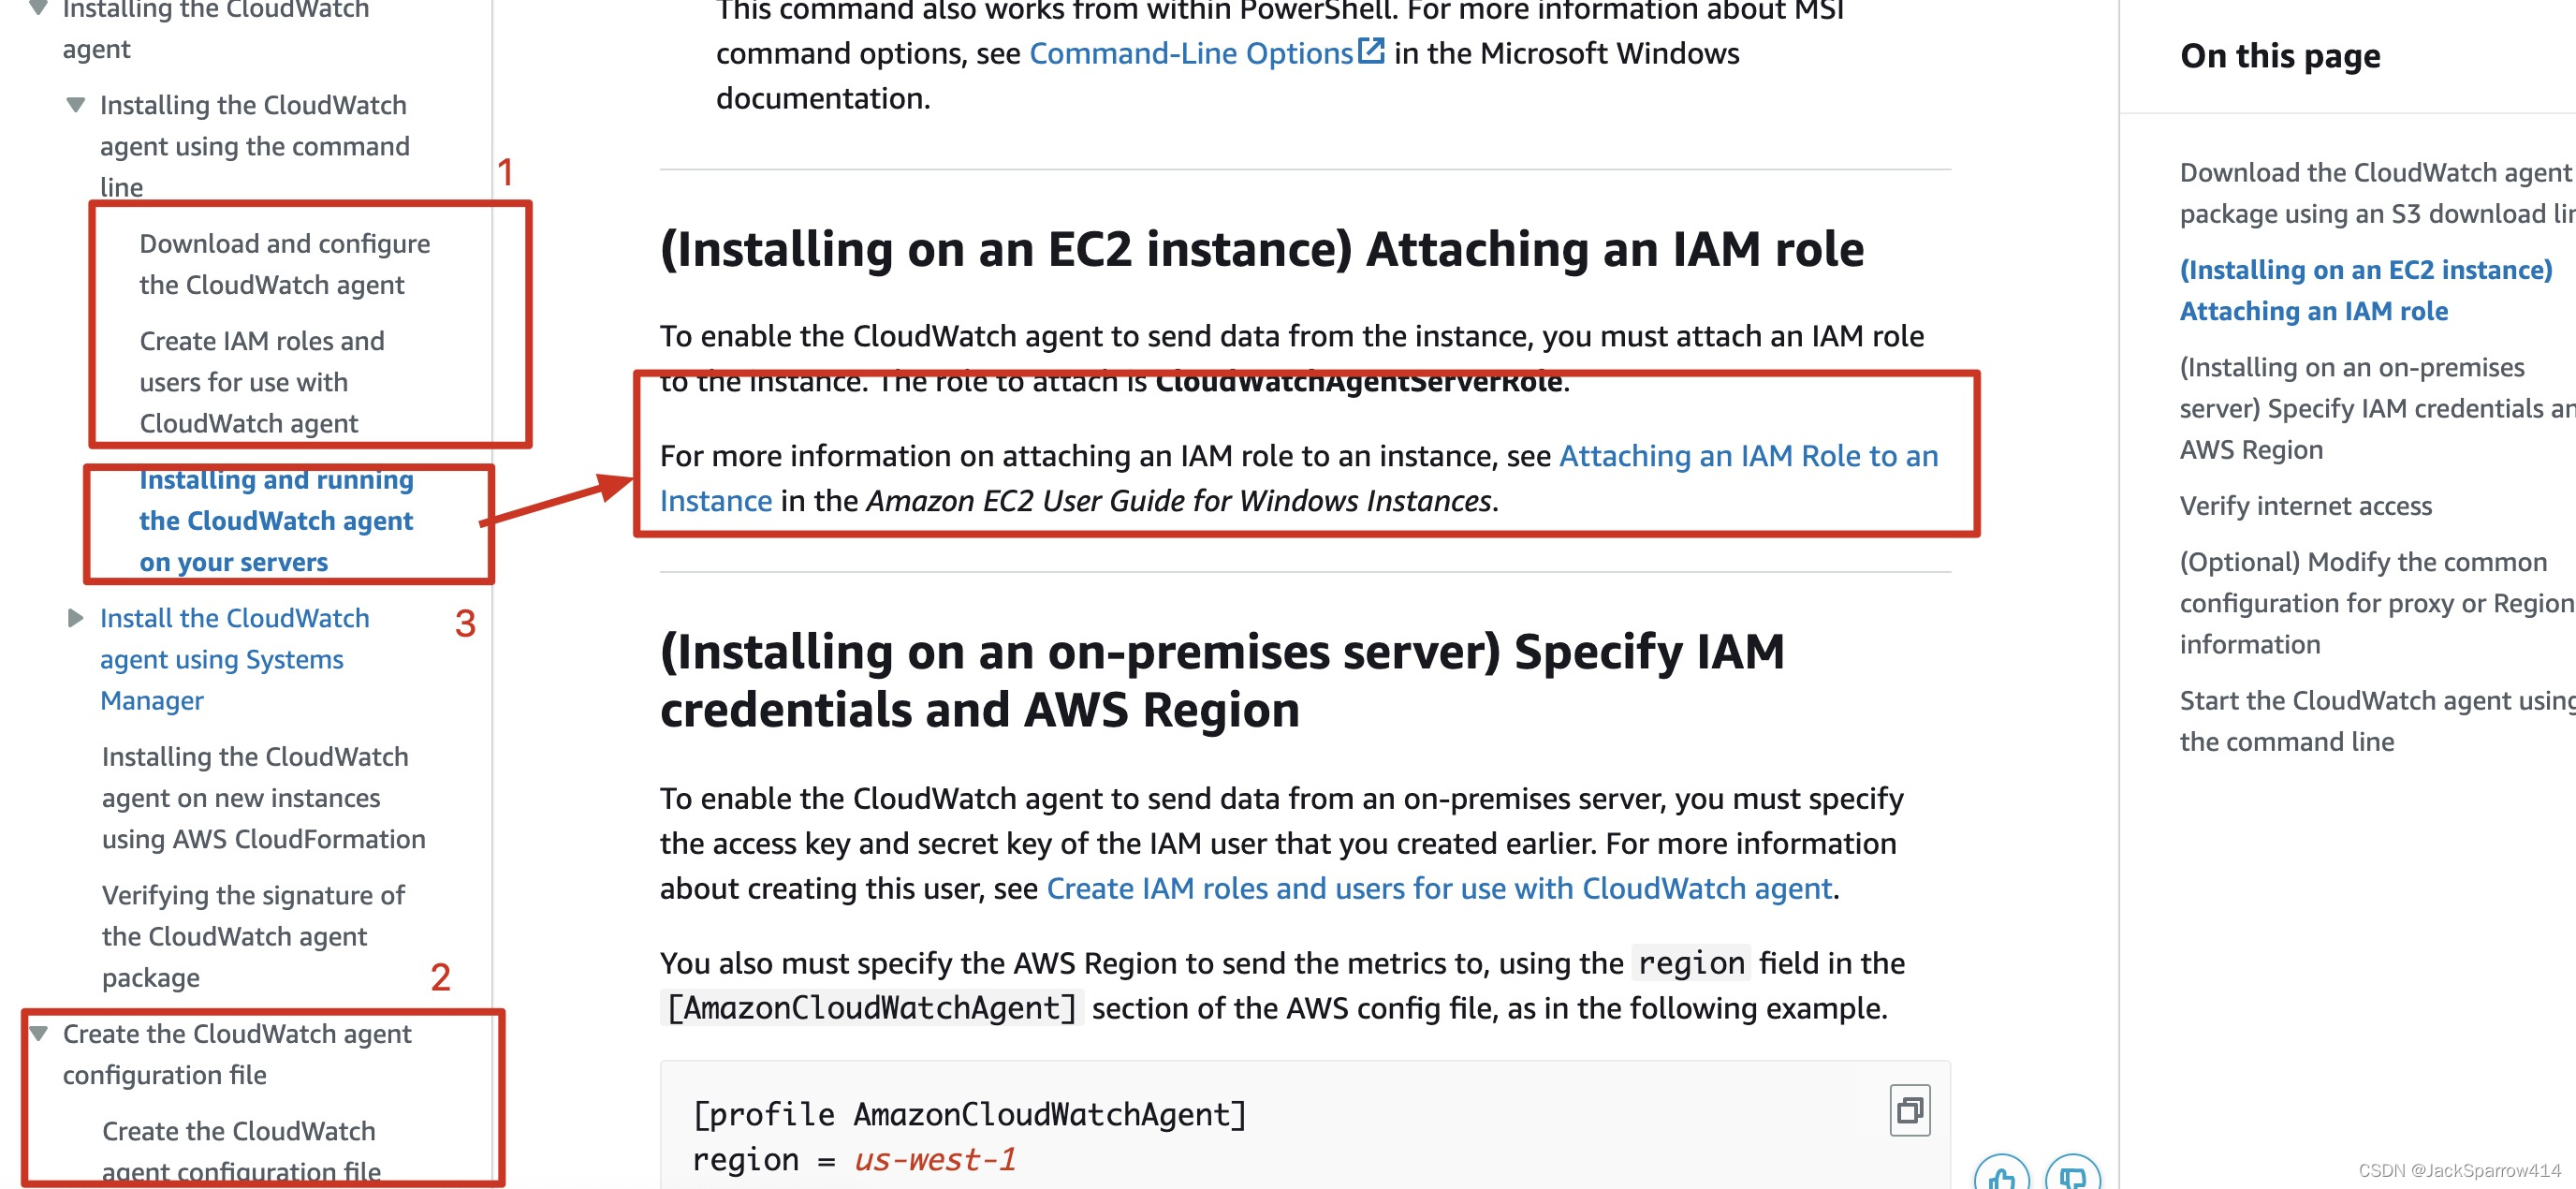
- First, download the agent and create an IAM role for AWS CloudWatch Logs.
- Next, create the files required by the agent. When creating its configuration, choose no for the collectd option; the other options can use their defaults. In the second part, you will be asked which log files to monitor. Enter their paths.
- Finally, attach the IAM role to the EC2 instance and start the agent.
The official documentation jumps around a little.
Test aws-cloudwatch-agent
After starting the agent, modify a monitored file on the instance. Check the CloudWatch console for a new log group and log stream. Their names are specified when configuring the agent.
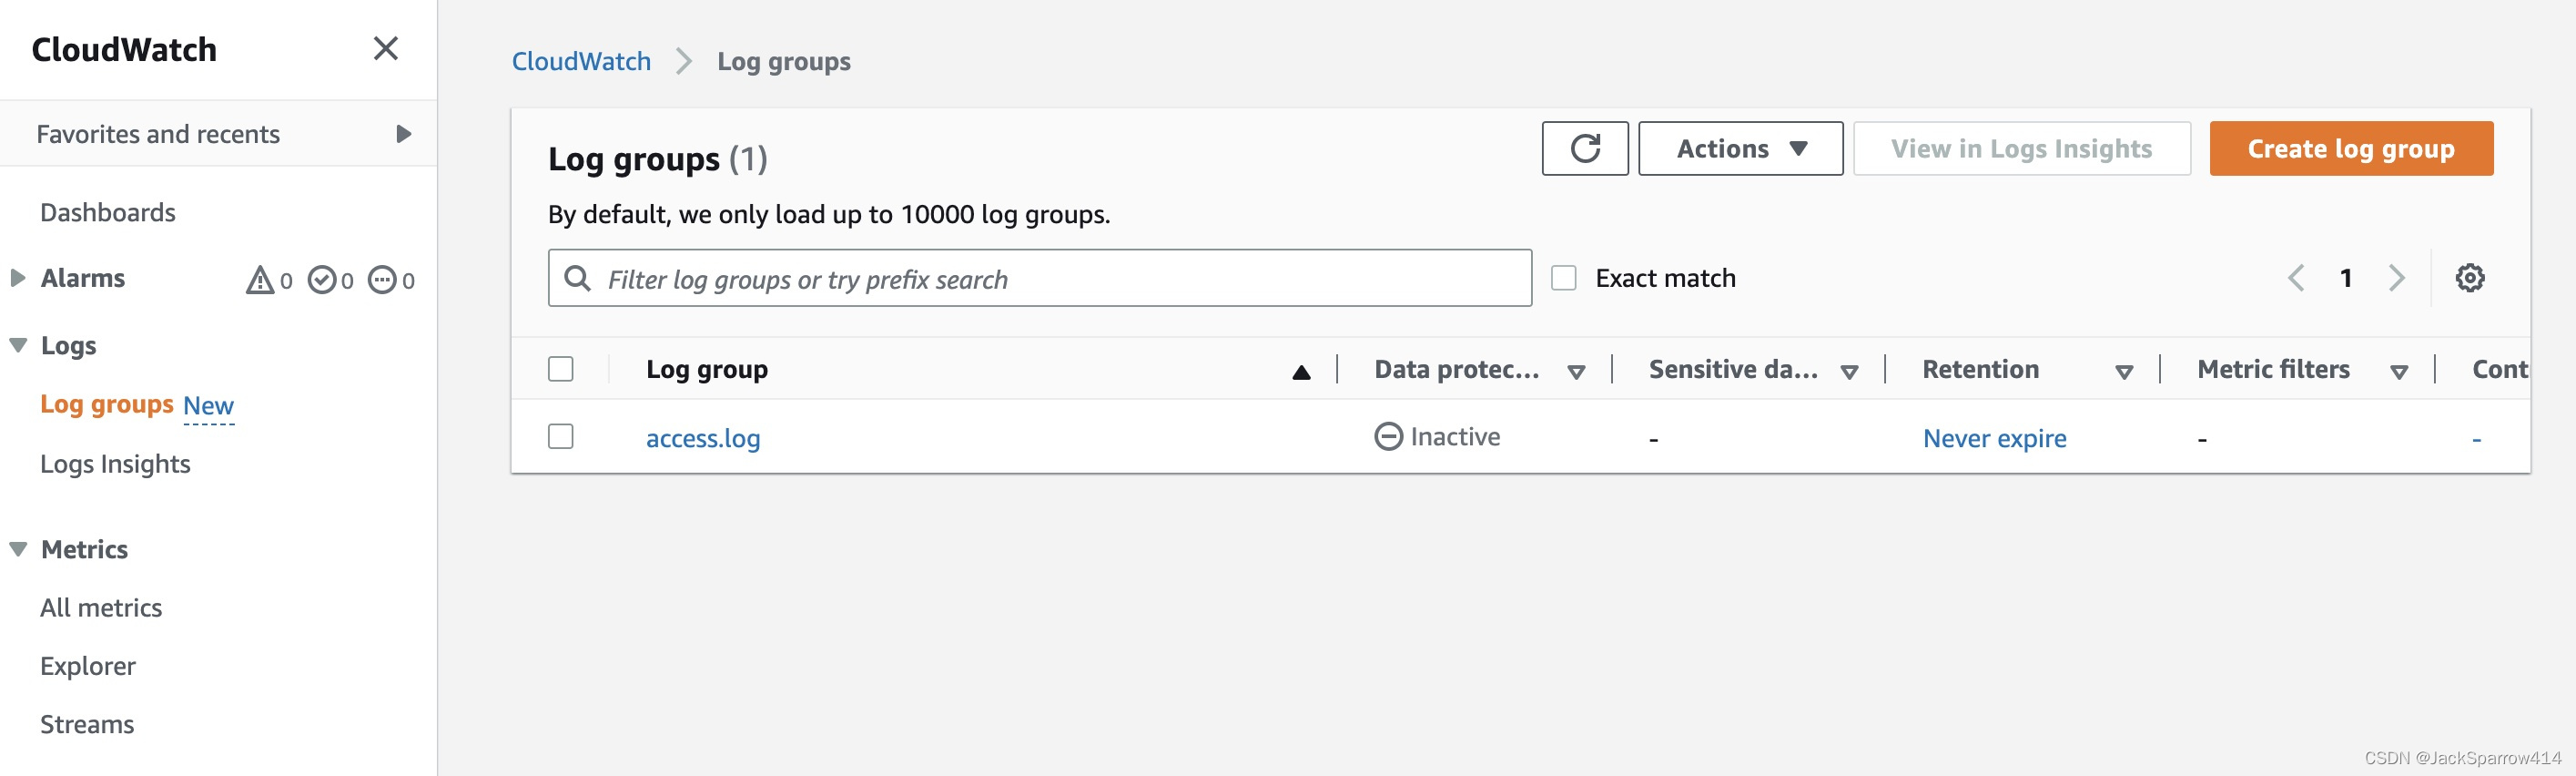 If logs do not reach CloudWatch, inspect the agent logs and consult the relevant official documentation.
Confirm that all the steps above work and that newly added logs appear in the console before continuing.
Deploy ELK with Docker Compose
For a quick single-node ELK deployment, use the popular docker-elk project on GitHub. It is straightforward: pull the code, adjust the configuration if necessary, and start the Docker-based ELK environment. See the project documentation for detailed instructions.
Before proceeding, make sure all three ELK components have started correctly and are accessible.
Deploy Filebeat with Docker Compose
The project above primarily provides Docker Compose configuration for ELK, although Filebeat is also available as an extension. I tested Filebeat separately. In the eventual production deployment, it will be included in the docker-compose.yml above.
mkdir filebeat
cd filebeat
Create three files in the filebeat directory:
- A Docker Compose file
version: "3.7" services: filebeat-aws: image: docker.elastic.co/beats/filebeat:VERSION_MATCHING_ELK container_name: filebeat user: root env_file: - .env volumes: - type: bind source: ./filebeat.docker.yml target: /usr/share/filebeat/filebeat.yml - type: bind source: /var/lib/docker/containers target: /var/lib/docker/containers read_only: true - type: bind source: /var/run/docker.sock target: /var/run/docker.sock read_only: true networks: - elk_elk networks: elk_elk: external: true - The Filebeat configuration file, filebeat.docker.yml
filebeat.inputs: - type: aws-cloudwatch enabled: true log_group_arn: YOUR_LOG_GROUP_ARN scan_frequency: 15s start_position: end access_key_id: ${AWS_ACCESS_KEY_ID} secret_access_key: ${AWS_SECRET_ACCESS_KEY} logging.metrics.enabled: false processors: - dissect: tokenizer: '%{clientIp} - - [%{access_timestamp}] %{response_time|integer} %{session_id} "%{http_request_method} %{url_path} %{http_version}" %{status_code|integer} %{http_request_body_bytes|integer} "%{http_request_referrer}" "%{user_agent_original}"' field: "message" target_prefix: "" ignore_failure: false - timestamp: field: "access_timestamp" layouts: - "2006-01-02T15:04:05Z" - "2006-01-02T15:04:05.999Z" - "2006-01-02T15:04:05.999-07:00" test: - "2019-06-22T16:33:51Z" - "2019-11-18T04:59:51.123Z" - "2020-08-03T07:10:20.123456+02:00" - drop_fields: fields: ["agent", "log", "cloud", "event", "message"] ignore_missing: true #output.console: # pretty: true output.logstash: hosts: ["logstash:5044"] - An environment file, .env, containing ec2-user’s access_key and secret_key
AWS_ACCESS_KEY_ID=
AWS_SECRET_ACCESS_KEY=
Configuration Explained
docker-compose.yml
- A note on networks in the first Docker Compose file: the ELK environment is already deployed and has its own network. To access that network from another Compose deployment without creating a new one, do two things. First, specify the ELK Compose network’s name under the service’s networks section. Second, add external: true under the top-level networks section. See external in Compose.
- Whether to change the service’s network name depends on the directory containing docker-compose.yml. My directory is elk and the network is named elk, so Docker creates elk_elk by default. If your directory is different, adjust the name accordingly. For network naming, see Docker Compose networking and the top-level networks specification.
- For Docker Swarm, allowing other Docker containers to access the Swarm network requires the attachable setting. See the Compose network specification and Docker Engine’s overlay network documentation.
Filebeat Configuration
Configure the AWS CloudWatch Input
See the official documentation for the configuration options.
Points to Check
Filebeat pulls logs through the AWS CloudWatch Logs API. For API usage, see the CloudWatch Logs CLI. Account for the number of API calls when designing the solution. CloudWatch Logs calls these limits service quotas. See Filebeat’s api-sleep setting and the FilterLogEvents limits in the service quota documentation.
Configure the Output
With the network configuration above, Filebeat can access the ELK network. Set the output host directly to the Logstash service name in ELK’s docker-compose.yml. Note: Filebeat supports only one output configuration, not multiple outputs.
Configure Processors
This depends on the actual access_log format configured in Tomcat. I will use my own configuration as an example.
Set Tomcat’s access_log Output Format
Configure access_log in Tomcat’s server.xml
<Valve className="org.apache.catalina.valves.AccessLogValve" directory="logs"
prefix="access_log" suffix=".txt"
pattern="%h %l %u [%{yyyy-MM-dd'T'HH:mm:ss.SSSZ}t] %D %S "%r" %s %b "%{Referer}i" "%{User-Agent}i""
renameOnRotate="true"
requestAttributesEnabled="true" />For the settings above, see Tomcat’s Access Log documentation. Filter out local network IP addresses.
<Valve className="org.apache.catalina.valves.RemoteIpValve"
			internalProxies="172\.16\.\d{1,3}\.\d{1,3}" />
For these options, see Remote IP configuration under Access Control.
Configure access_log in Spring Boot
Find the configuration property names under
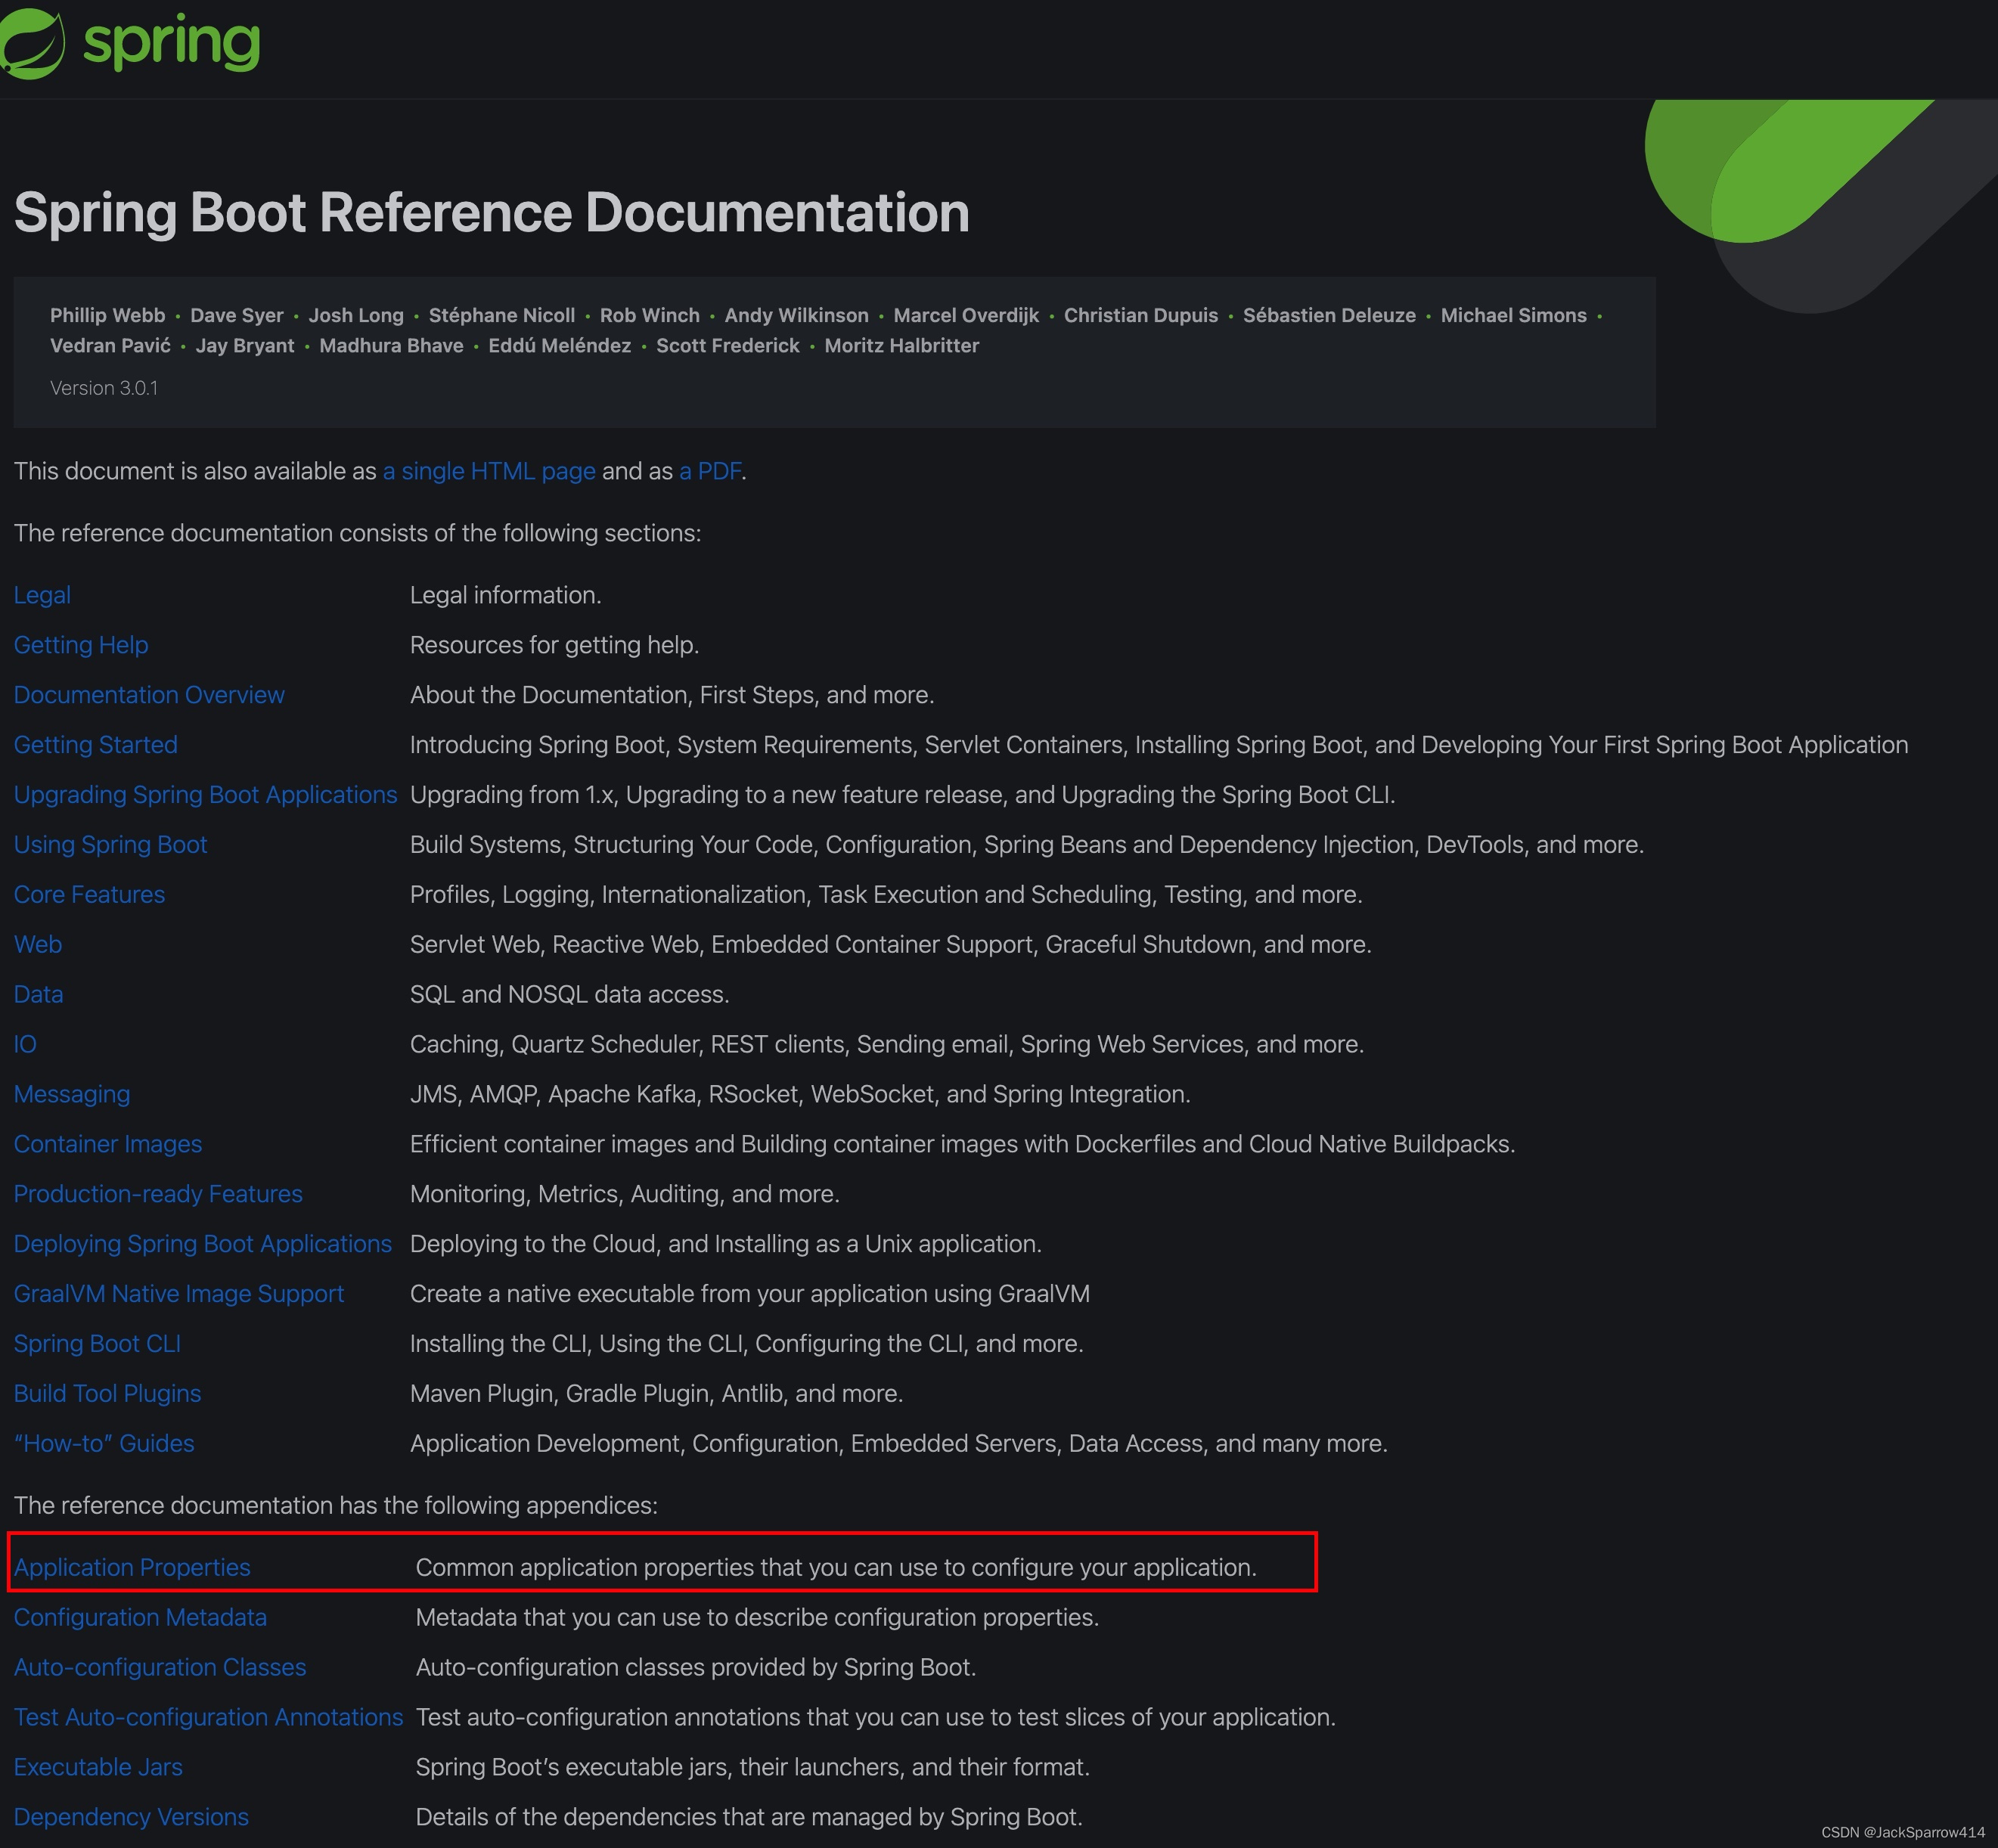 Spring Boot documentation > Application Properties > Server Properties.
server:
  port: 18081
  servlet:
    context-path: /pool2
  tomcat:
    accesslog:
      enabled: true
      pattern: "%h %l %u [%{yyyy-MM-dd'T'HH:mm:ss.SSSZ}t] %D %S '%r' %s %b '%{Referer}i' '%{User-Agent}i'"
      directory: /tmp/logs/tomcat
      prefix: access_log
    basedir: /var
Specify basedir; otherwise, Tomcat cannot generate access_log files. For details, see this blogger’s explanation.
Remote IP configuration uses the default. The Spring Boot default is:
10\.\d{1,3}\.\d{1,3}\.\d{1,3}|192\.168\.\d{1,3}\.\d{1,3}|169\.254\.\d{1,3}\.\d{1,3}|127\.\d{1,3}\.\d{1,3}\.\d{1,3}|172\.1[6-9]{1}\.\d{1,3}\.\d{1,3}|172\.2[0-9]{1}\.\d{1,3}\.\d{1,3}|172\.3[0-1]{1}\.\d{1,3}\.\d{1,3}|0:0:0:0:0:0:0:1|::1
Before proceeding, confirm that Filebeat connects to CloudWatch Logs and pulls logs successfully.
Testing
- Temporarily change Filebeat’s output to the console, start it, and confirm that no errors occur.
- Add content to a monitored log on EC2—for example, an entry from a local Tomcat access_log.
- Check the log stream in the CloudWatch console’s log group for the new entry. Under normal conditions, it appears in about two seconds.
- Check whether Filebeat prints the log entry you just added on EC2, using a command such as:
docker logs --tail 10 -f filebeat
Configure Logstash
Here is an example configuration for the access_log format above.
input {
  beats {
    port => 5044
    client_inactivity_timeout => 3600
    codec => "json"
    tags => [aws_access_log]
  }
}
filter {
  if "aws_access_log" in [tags] {
       #       handle internal ip
        if [clientIp] =~ "^10.0.*|^192.168.*|^172.16.*|^127.0.*|0.0.0.0|^0:0:0:0*" {
                mutate {
                        add_tag => ["private internets"]
                }
        }
#       convert ip to IP type from String Type
        if [clientIp] and "private internets" not in [tags] {
                geoip {
                        source => "clientIp"
                        target => "[client][geo]"
                }
        }
        useragent {
           source => 'user_agent_original'
        }
        date {
           match => ["access_timestamp", "yyyy-MM-dd'T'HH:mm:ss.SSSZ"]
        }
        mutate {
                add_field => {
                       "[@metadata][server_name]" => "%{[awscloudwatch][log_stream]}"
                }
                rename => {
                        "clientIp" => "[client][ip]"
                        "status_code" => "[http][response][status_code]"
                        "http_request_method" => "[http][request][method]"
                        "http_request_referrer" => "[http][request][referrer]"
                        "http_request_body_bytes" => "[http][request][body][bytes]"
                        "http_version" => "[http][version]"
                        "url_path" => "[url][path]"
                        "log.file.path" => "[log][file][path]"
                        "user_agent_original" => "[user_agent][original]"
                        "ecs.version" => "[ecs][version]"
                }
                remove_field => ["[input]","[host]","access_timestamp"]
        }
        if [client][geo]{
                mutate {
                        remove_field => ["[client][geo][ip]"]
                }
        }
  }
}
output {

       if "aws_access_log" in [tags] {
                elasticsearch {
                        hosts => "elasticsearch:9200"
                        user => "logstash_internal"
                        password => "${LOGSTASH_INTERNAL_PASSWORD}"
                        index => "ecs-logstash-aws-access-log-%{[@metadata][server_name]}-%{+YYYY.MM.dd}"
               }
        }
}
Configuration Explained
- Give every input its own tags so that filters can distinguish its processing from other inputs. In practice, Logstash may have several inputs, each with different processing logic, so tags are useful for separating them.
- This configuration uses Elasticsearch’s built-in ecs-logstash index template directly.
- Mark private IP addresses in access_log and skip IP lookup for them, since they cannot be resolved and cause errors.
- For other IP addresses, use the Logstash geoip filter.
- Parse access_log user agents with the Logstash useragent filter.
- Use the Logstash date filter to convert the timestamp string in access_log to @timestamp.
- Use the Logstash mutate filter to rename fields to match ECS.
- Include the EC2 server name in index names to distinguish each server’s access_log and make indexes easier to identify. Use Logstash @metadata for this.
Test the Complete Pipeline
- Restart Logstash and confirm that no errors occur.
- Change Filebeat’s output to Logstash, restart Filebeat, and check for errors.
- Add some entries to the monitored log file on EC2.
- Check Kibana for a new ecs-logstash-* index.
Troubleshooting
If you verify each step before proceeding as described above, the complete pipeline should come together smoothly. If the logs still do not reach Elasticsearch, try these checks:
- Add stdout to the Logstash output to check whether it actually receives logs from Filebeat.
- If that works, inspect Elasticsearch’s logs for errors, for example:
docker logs --tail 5 -f elasticsearch
Notes
- Many settings above require careful reading of the relevant official documentation. This post presents the overall approach rather than a step-by-step tutorial.
- I have not included AWS documentation links, because the relevant service consoles provide entry points to their documentation if you look around the console pages.
- Once you understand these configuration files, small adjustments or following the same patterns should be enough to meet your actual requirements.