Table of contents
Open Table of contents
Common Elasticsearch Operations
Common Document Operations
Updating
For a regular update, we can use a partial update
PUT /my-articles/_update/id
{
    "doc":{
        "title":"UPDATED_ARTICLE_TITLE"
    }
}
As for update by query, which requires scripts. I don’t have a scenario that uses scripts yet, so I’ll skip this part for now
Deleting
DELETE /my-articles/_doc/idCommon Index Operations
Now, following the existing scenario, let’s refine it a bit. We already have the basic data structure for article — can we add more scenarios? When viewing article data, we’d like to show which country and city the article comes from, so that in Kibana we can conveniently see an overview of the data on a map. To do that, we need to modify the mapping of the current my-articles index by adding a field that represents geographic location.
Prerequisites
To enable plotting in Kibana, we generally define these fields:
- A field named ip with type IP
- A field named location with type Geo-point, containing the latitude and the longitude
Adding a Field to the Mapping
Add two fields, client.ip and client.geo.location, to my-article. Note that the dot here represents a nested structure — the field is not literally named client.ip.
PUT /my-articles/_mapping
{
  "properties":{
    "client":{
      "properties":{
        "ip":{
          "type":"ip"
        },
        "geo":{
          "properties":{
            "location":{
              "type":"geo_point"
            }
          }
        }
      }
    }
  }
}
After the modification, we can take a look at the mapping structure:
GET /my-articles/_mappingModifying a Field in the Mapping
At the same time, we feel that integer is too small for reading_count in article, and we need to change it to long — in other words, change the data type of an existing field
For a field that already has data, we can’t modify its index directly. We need to create a new index and then reindex the data into it, which is similar to copying.
PUT /articles
{
  "mappings": {
    "properties": {
      "reading_count":{
        "type": "long"
      }
    }
  }
}
reindex
Use reindex to copy my-articles into articles again, including the original data
POST _reindx
{
    "source":{
        "index":"my-articles"
    },
    "dest":{
        "index":"articles"
    }
}
Deleting an Index
Delete indexes that are no longer needed
DELETE /my-articlesUsing an Index Template
Why use an index template?
- In one case, after integrating Logstash, we want to generate indexes by day, and when an index is generated we want it to have some customized fields;
- or the company’s Elasticsearch has common conventions that require a unified prefix and mandate that certain fields must exist
This is where an index template comes in handy.
Here we always use a single index rather than generating one per day, so we can set some conventions for the current index. When more data similar to article data comes along, we’ll require it to stay basically consistent with the article data index as well.
Adding an Index Template
Continuing with the scenario above: now that we have the geographic location field, going forward we’ll need to parse IPs in a Logstash filter and then output them to Elasticsearch.
The Problem
If we don’t define the geo-related fields in Elasticsearch in advance, they default to the text type instead of IP and geo_point. So to prevent this problem, we define an index template first.
So our template should cover the following aspects:
- IP information fields
- The location field
- An @timestamp field compliant with the ECS specification, with type date. The ECS specification will be covered below
- For the created and updated fields in the JSON data, the data format is yyyy-MM-dd HH:mm:ss. To map them correctly as date fields (if left unhandled, they default to text), we need to define dynamic field mappings. The first blog post mentioned dynamic field mapping: when we haven’t predefined an index, Elasticsearch dynamically defines the fields in the index based on the data format, and at that point some fields may not be handled quite correctly. So we declare them in advance; during dynamic mapping, when Elasticsearch encounters a format we’ve declared, it directly uses our predeclared mapping. For more details, see dynamic mapping
PUT /_index_template/article_template
{
  "priority":1,
  "index_patterns": ["articles*"],
  "template":{
    "mappings" : {
            "properties" : {
              "@version" : {
                "type" : "keyword"
              },
               "@timestamp": {
                  "type": "date"
       			 },
              "client" : {
                "properties" : {
                  "geo" : {
                    "properties" : {
                      "location" : {
                        "type" : "geo_point"
                      }
                    }
                  },
                  "ip" : {
                    "type" : "ip"
                  }
                }
              }
            },
            "dynamic_date_formats": ["yyyy-MM-dd HH:mm:ss"]
          },
          "aliases" : { }
  }
}
Viewing an Index Template
View the index template we just created.
Look up the index template
GET /_index_template/article*Modifying an Index Template
Deleting an Index Template
Using the Built-in Index Template for Log Collection
Updated on September 2, 2022
If you’re only collecting logs directly from Logstash, I highly recommend using the built-in index template named ecs-logstash. Of course, if you want customization, you can still use the steps above.
However, if you want to customize on top of ECS, it’s better to build on the ecs-logstash index template.
Integrating Logstash
So far, we’ve installed ELK, learned the basics of Elasticsearch, and configured the index and index template we need. Next up is integrating Logstash, which is much closer to an enterprise scenario.
Understanding Logstash in one sentence:
Logstash’s job is to receive data, process data, and output data.
Scenario Design
Same as at the beginning: in real enterprise development, how does article data get into Elasticsearch? The scenario generally looks like this:
- The application outputs logs
- Logstash receives the logs
- processes them
- and outputs them to Elasticsearch
Here we send logs directly from the application to Logstash — that is, Logstash receives them using the tcp input plugin.
Preparing the Sample Application
Complete sample application code
The sample application’s log4j2.xml configuration:
<Configuration>
    <Appenders>
        <Console name="Console" target="SYSTEM_OUT">
<!--            Using %C %M directly greatly hurts log4j2 performance-->
<!--            <PatternLayout pattern="%d{HH:mm:ss.SSS} %-5level %C{36}#%M (%X{clientIp}, %X{id}) %m%n"/>-->
            <PatternLayout pattern="%d{HH:mm:ss.SSS} %-5level %X{scn} %X{smn} (%X{clientIp}, %X{userId}) %m%n"/>
        </Console>
        <!--Send directly to the specified port over TCP-->
        <Socket name="tcp" protocol="tcp" host="192.168.0.104" port="12201" immediateFail="true" immediateFlush="false"
                bufferedIO="false">
            <!--Output messages in ECS JSON format-->
            <JsonTemplateLayout eventTemplateUri="classpath:EcsLayout.json"/>
        </Socket>
    </Appenders>
    <Loggers>
        <Root level="info">
            <AppenderRef ref="Console"/>
            <AppenderRef ref="tcp"/>
        </Root>
    </Loggers>
</Configuration>
Here, the Java class where the log originates, the method name, and common attributes like clientIp and userId are output through MDC.
The ECS Specification
In the sample application, we configured EcsLayout.json in the Socket appender. Why choose it? ECS is a data specification, and data that complies with ECS is easier to extend when processing. The ECS specification defines a set of core fields for us to use; when defining ES data structures in everyday work, we should try to follow this specification.
To look up ECS fields and other conventions, refer to the ECS documentation
Receiving Application Logs
Create a configuration file:
touch artilce.confWrite the input section:
input {
   tcp {
      host => "localhost"
      port => 12201
      codec => json
   }
}
Processing IP Information (and Handling Local IPs)
We need to convert the clientIp from the JSON data into the geographic information we need above.
Use the geoip filter
A reminder for readers: geoip cannot parse local IPs, which would cause IP parsing to fail. To handle this situation, we can filter out local IPs and only let an IP enter the geoip filter if it is not a local IP.
How do we tell whether an IP is local? A regular expression is enough. For conditional judgments in Logstash, refer to the Conditionals section
fileter {
    if [clientIp] =~ "^10.0.*" or [clientIp] =~ "^127.0.*" or [clientIp] == "0.0.0.0" or [clientIp] =~ "^0:0:0:0*" {
        mutate {
            add_tag => ["internal"]
        }
     }
     if [clientIp] and "internal" not in [tags] {
        geoip {
          source => "clientIp"
          target => "[client][geo]"
        }
     }
}
When the IP is a local IP, we add a tag — internal — to mark it as a local IP.
Note
After geoip processing here, the target is [client][geo], which keeps it consistent with the nested structure defined above. Never write it as target => client.geo — that would be a single field, not a nested structure.
For details on writing fields in Logstash, refer to Field Reference and Field syntax
Processing JSON
We print the complete article data as JSON into the log message. To make it match the article data structure we defined, we also need to parse the JSON data, using the json filter. When the data isn’t JSON, we don’t process it; meanwhile:
filter {
  json {
    source => "message"
    skip_on_invalid_json => true
  }
}
Renaming Field Names
Updated on September 2, 2022 Since the ECS-format logs output by Log4j2 in Java are all dot-separated — for example, log.logger — we must use mutate’s rename to convert them into nested format, such as [log][logger].
Is there a more convenient way? Yes — the official de-dot plugin can do the conversion above, but this operation is extremely expensive. The official advice is not to use this plugin unless you have no other choice… so let’s just honestly stick with rename.
Since we’ve adopted the ECS specification, we need to rename some fields in the JSON data to ECS-compliant fields and delete the extra fields.
Use the mutate filter. Here we use the two processors rename and remove_field.
filter {
   mutate {
		rename => {
		  "clientIp" => "[client][ip]"
		  "userId" => "[client][user][id]"
		  "smn" => "[log][origin][function]"
		  "scn" => "[log][origin][file][name]"
		  "readingCount" => "reading_count"
      "articleContent" => "article_content"
      "articleGenre" => "article_genre"
		}
		remove_field => ["[client][geo][ip]","[client][geo][latitude]","[client][geo][longitude]","[message]"]
    }
}
Note: client.geo.ip is not part of the original log; after geoip processing, the IP’s default location is client.geo.ip. But the ECS specification puts the IP under other fields, so after the rename here, we delete the extra fields.
The Final filter Configuration
The complete filter section is as follows:
fileter {
     json {
        source => "message"
        skip_on_invalid_json =>true
    }
    if [clientIp] =~ "^10.0.*" or [clientIp] =~ "^127.0.*" or [clientIp] == "0.0.0.0" or [clientIp] =~ "^0:0:0:0*" {
        mutate {
            add_tag => ["internal"]
        }
     }
     if [clientIp] and "internal" not in [tags] {
        geoip {
          source => "clientIp"
          target => "[client][geo]"
        }
     }
     mutate {
        rename => {
          "clientIp" => "[client][ip]"
          "userId" => "[client][user][id]"
          "smn" => "[log][origin][function]"
          "scn" => "[log][origin][file][name]"
          "readingCount" => "reading_count"
          "articleContent" => "article_content"
          "articleGenre" => "article_genre"
        }
			 remove_field => ["[client][geo][ip]","[client][geo][latitude]","[client][geo][longitude]","[message]"]
    }
}
Outputting to Elasticsearch
In a test environment, you can use the stdout plugin for debugging to see what the final data looks like
For outputs, you can choose file and elasticseach.
output {
  stdout {}
  file {
  # Generate the year-month-day format
      path => "D:\ElkLogs\testEcs-%{+YYYY-MM-dd}.log"
  }
  elasticsearch {
	  hosts => ["localhost:9200"]
	  user => "elastic"
	  password => "password"
	  index => "articles"
  }
}
Extension: Elasticsearch Pipeline
Actually, Elasticsearch itself also supports what the filter section does — namely, Pipeline
Since this post is already getting a bit long, I won’t go into it here — I’m just bringing it up. A future post will cover it; if you’re interested, you can look into it.
Verifying the Flow
At this point, all preparation is complete. Now all data is fed dynamically into Elasticsearch as we call the web application’s endpoints.
To verify the accuracy of the overall flow, namely:
- the web application outputs logs
- Logstash processes the logs and outputs them to Elasticsearch
- Elasticsearch creates the index based on the index template
- the data is displayed
We’ll delete the index used in the previous two posts along with all the data in it:
DELETE /articlesStart the sample application we just prepared — a normal startup without errors is all we need.
-
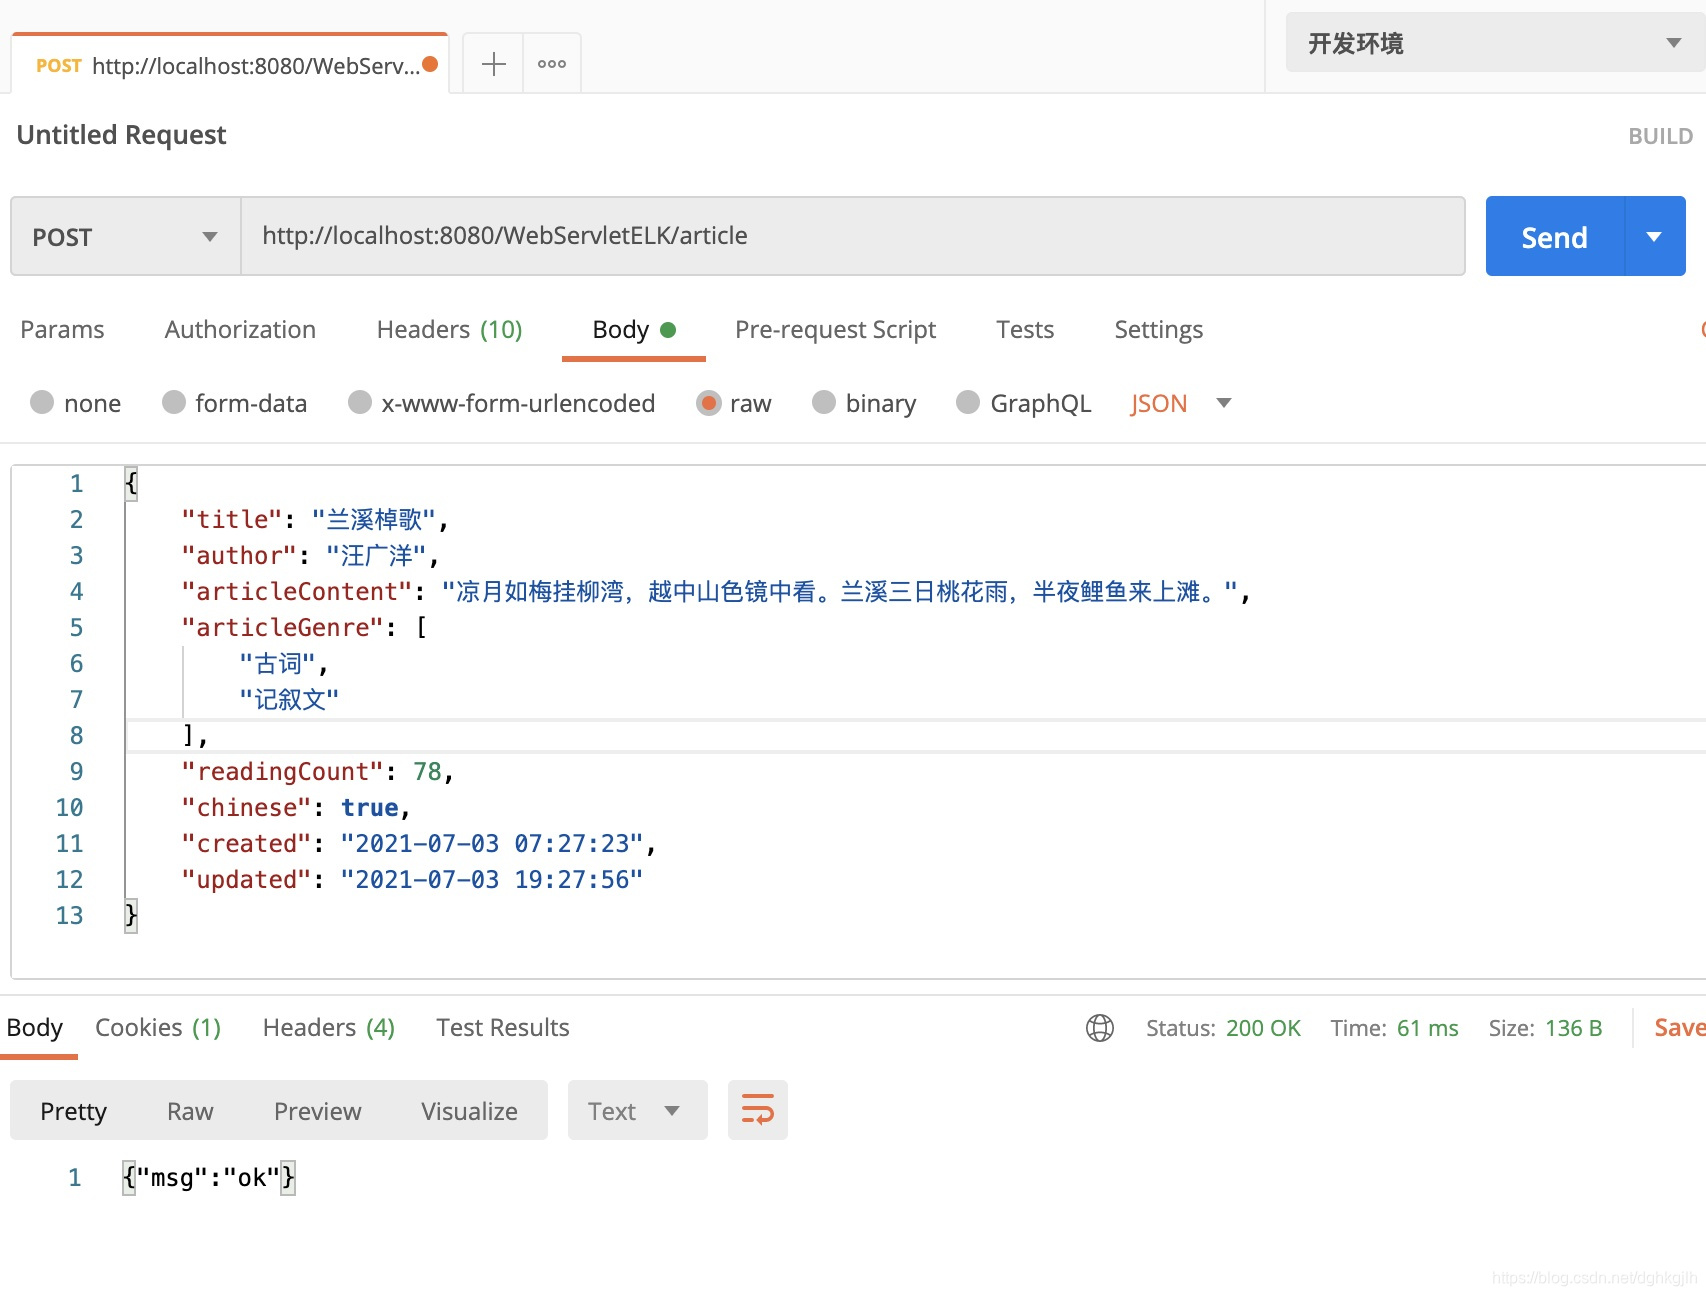
Call the endpoint
-
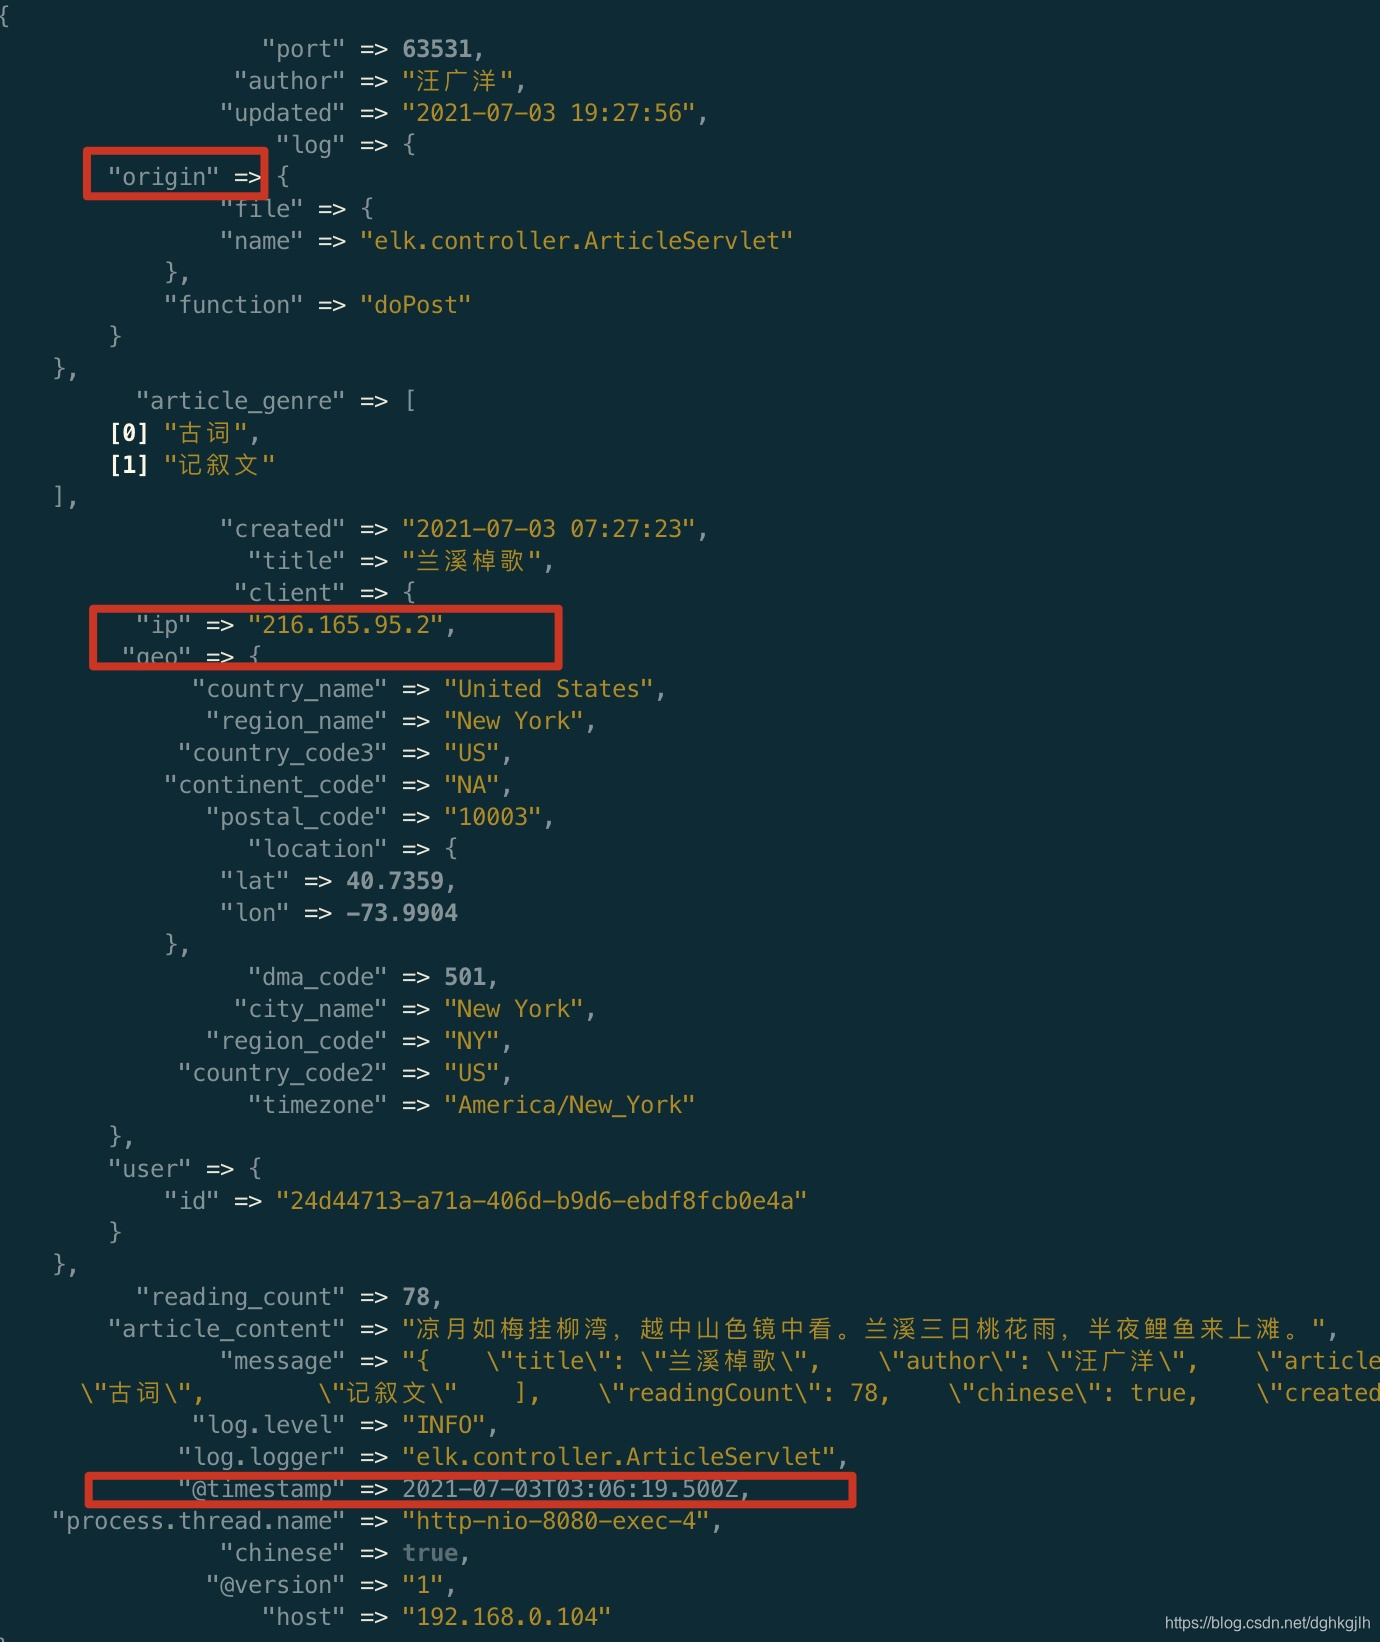
Check in the Logstash console
-
Check in Elasticsearch to see whether the final generated data matches our expectations
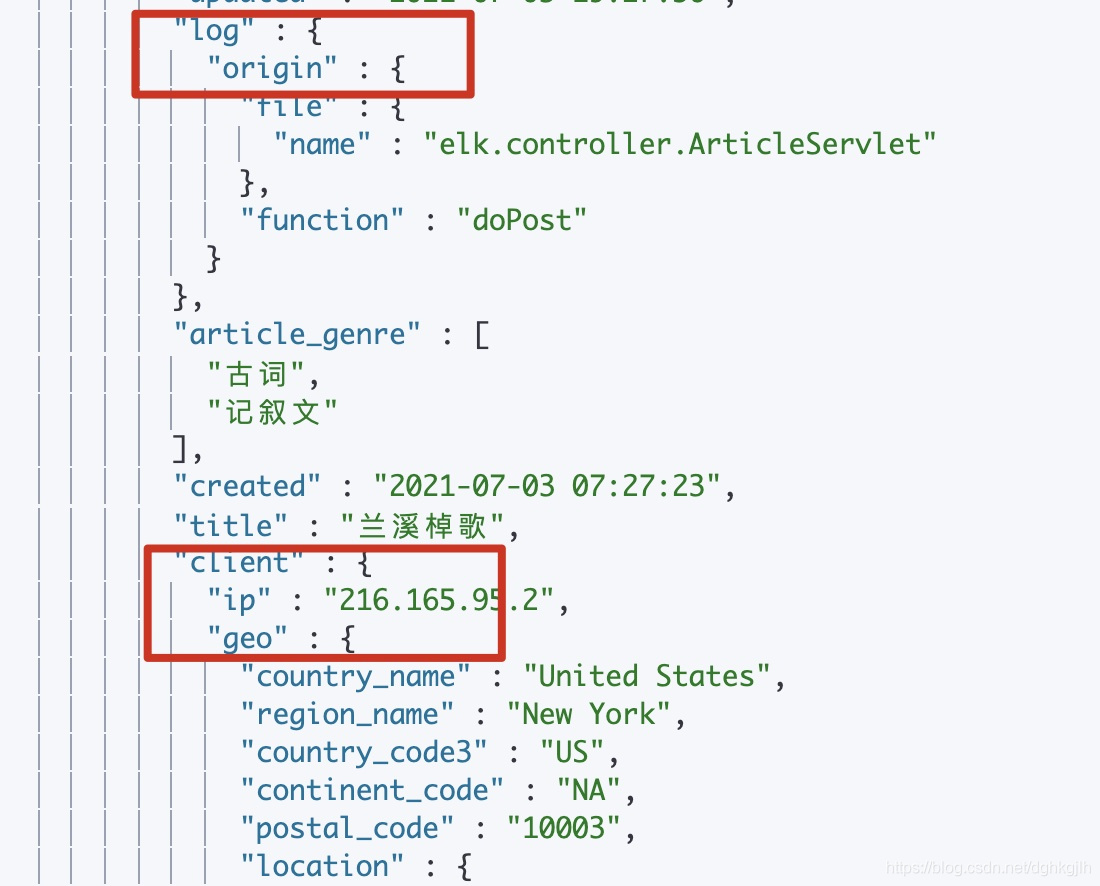
As you can see, the data in nested format is also correct.
-
Check in Kibana. Before using Kibana, don’t forget to create an index pattern.
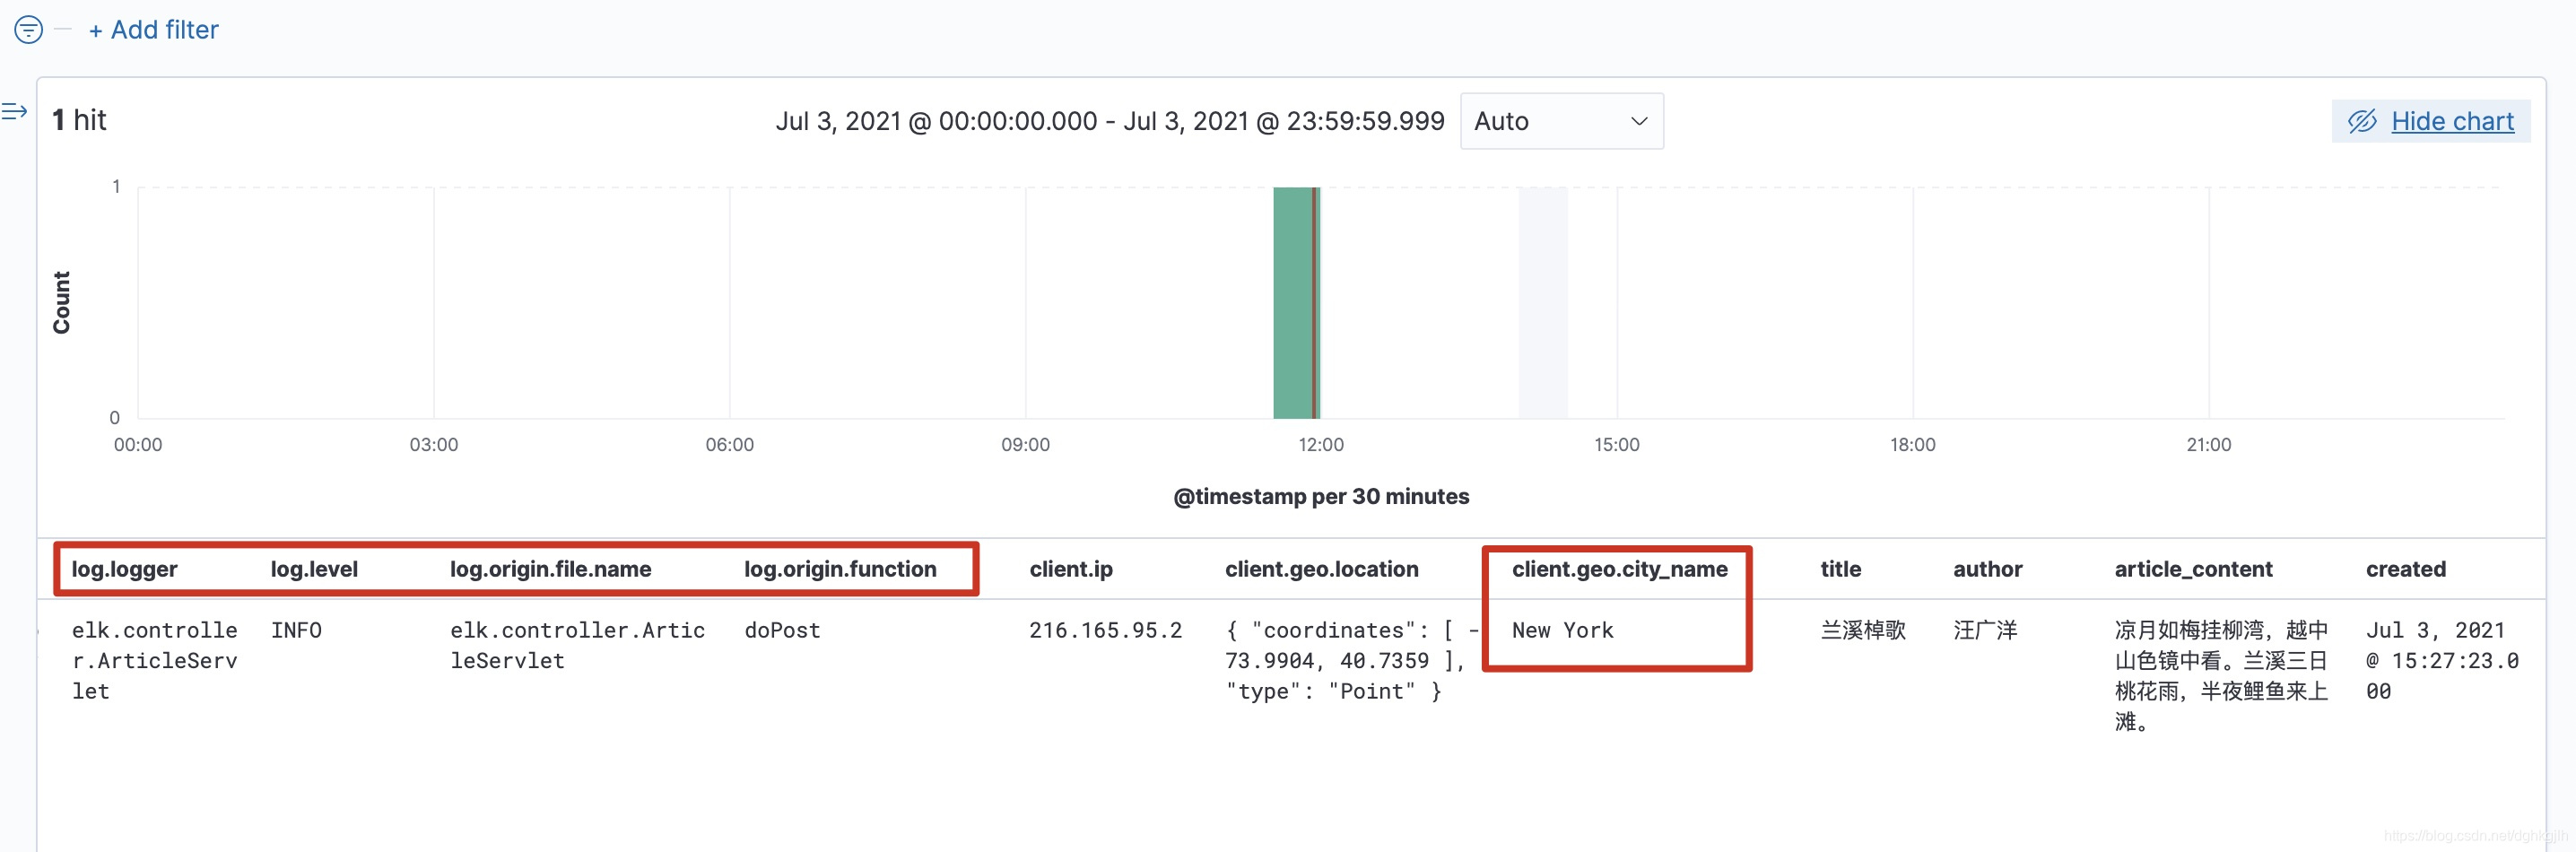
As you can see, the data format matches our expectations: the geographic location information has been parsed, the ECS-compliant fields are present, and the remaining custom fields form our article data structure.
Mind Map
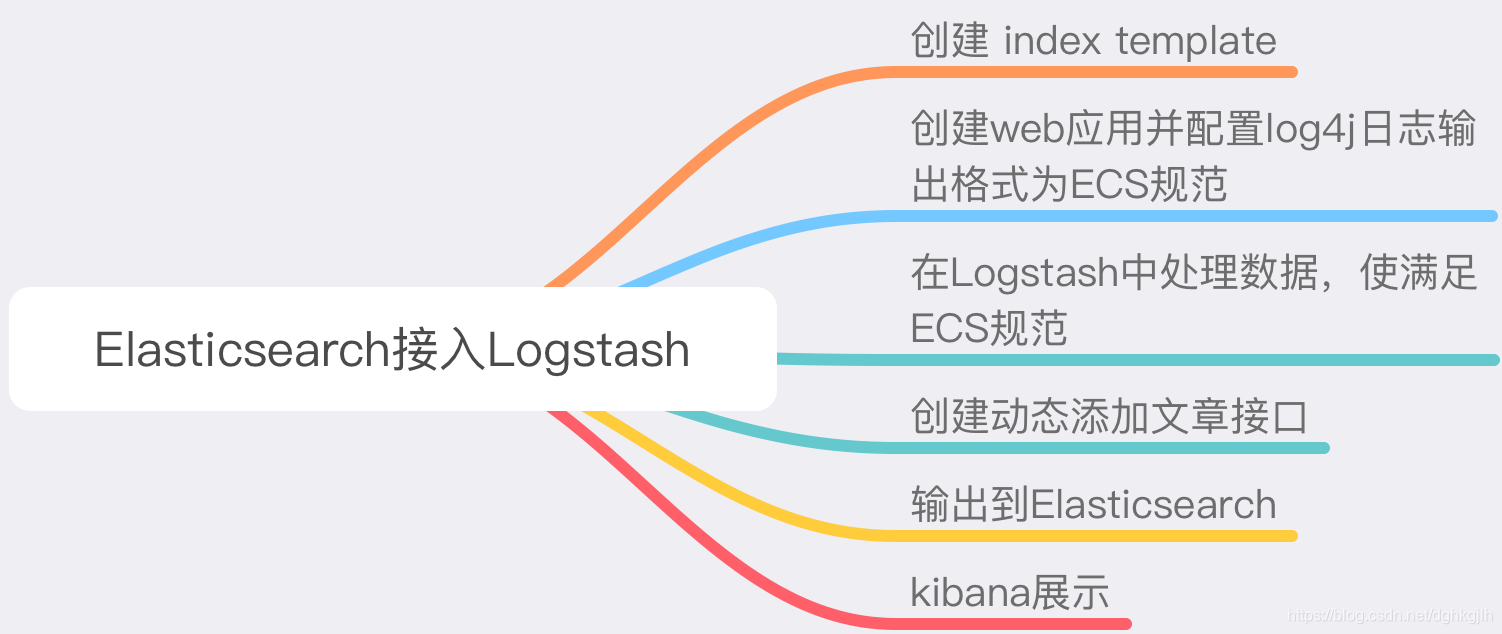
Now we have the complete flow and data with geographic location information. The next post will draw a map in Kibana.