Table of contents
Open Table of contents
Article body
This is the final article in the series on using Filebeat to synchronize production access_log data to Elastic Stack. It provides the complete final configuration and explains the approach.
Source Repository
All configuration below comes from the GitHub source repository.
Hardware Requirements
Together, these components use considerable space. Ensure sufficient memory and disk capacity. More available memory is preferable, and more disk space is always helpful.
If using Docker Desktop, check whether a memory limit is configured.
Configuration Files
docker-compose.yml
version: "2.2"

services:
  setup:
    image: docker.elastic.co/elasticsearch/elasticsearch:${STACK_VERSION}
    volumes:
      - certs:/usr/share/elasticsearch/config/certs
    user: "0"
    #    Create HTTPS certificates
    #  Set the built-in Kibana user password: https://www.elastic.co/guide/en/elasticsearch/reference/8.12/security-api-change-password.html
    command: >
      bash -c '
        if [ x${ELASTIC_PASSWORD} == x ]; then
          echo "Set the ELASTIC_PASSWORD environment variable in the .env file";
          exit 1;
        elif [ x${KIBANA_PASSWORD} == x ]; then
          echo "Set the KIBANA_PASSWORD environment variable in the .env file";
          exit 1;
        fi;
        if [ ! -f config/certs/ca.zip ]; then
          echo "Creating CA";
          bin/elasticsearch-certutil ca --silent --pem -out config/certs/ca.zip;
          unzip config/certs/ca.zip -d config/certs;
        fi;
        if [ ! -f config/certs/certs.zip ]; then
          echo "Creating certs";
          echo -ne \
          "instances:\n"\
          "  - name: es01\n"\
          "    dns:\n"\
          "      - es01\n"\
          "      - localhost\n"\
          "    ip:\n"\
          "      - 127.0.0.1\n"\
          "  - name: es02\n"\
          "    dns:\n"\
          "      - es02\n"\
          "      - localhost\n"\
          "    ip:\n"\
          "      - 127.0.0.1\n"\
          "  - name: es03\n"\
          "    dns:\n"\
          "      - es03\n"\
          "      - localhost\n"\
          "    ip:\n"\
          "      - 127.0.0.1\n"\
          > config/certs/instances.yml;
          bin/elasticsearch-certutil cert --silent --pem -out config/certs/certs.zip --in config/certs/instances.yml --ca-cert config/certs/ca/ca.crt --ca-key config/certs/ca/ca.key;
          unzip config/certs/certs.zip -d config/certs;
        fi;
        echo "Setting file permissions"
        chown -R root:root config/certs;
        find . -type d -exec chmod 750 \{\} \;;
        find . -type f -exec chmod 640 \{\} \;;
        echo "Waiting for Elasticsearch availability";
        until curl -s --cacert config/certs/ca/ca.crt https://es01:9200 | grep -q "missing authentication credentials"; do sleep 30; done;
        echo "Setting kibana_system password";
        until curl -s -X POST --cacert config/certs/ca/ca.crt -u "elastic:${ELASTIC_PASSWORD}" -H "Content-Type: application/json" https://es01:9200/_security/user/kibana_system/_password -d "{\"password\":\"${KIBANA_PASSWORD}\"}" | grep -q "^{}"; do sleep 10; done;
        echo "All done!";
      '
    healthcheck:
      test: ["CMD-SHELL", "[ -f config/certs/es01/es01.crt ]"]
      interval: 1s
      timeout: 5s
      retries: 120

  es01:
    depends_on:
      setup:
        condition: service_healthy
    image: docker.elastic.co/elasticsearch/elasticsearch:${STACK_VERSION}
    volumes:
      - certs:/usr/share/elasticsearch/config/certs
      - esdata01:/usr/share/elasticsearch/data
    ports:
      - 19200:9200
    environment:
      - node.name=es01
      - cluster.name=${CLUSTER_NAME}
      - cluster.initial_master_nodes=es01,es02,es03
      - discovery.seed_hosts=es02,es03
      - ELASTIC_PASSWORD=${ELASTIC_PASSWORD}
      - bootstrap.memory_lock=true
      - xpack.security.enabled=true
      - xpack.security.http.ssl.enabled=true
      - xpack.security.http.ssl.key=certs/es01/es01.key
      - xpack.security.http.ssl.certificate=certs/es01/es01.crt
      - xpack.security.http.ssl.certificate_authorities=certs/ca/ca.crt
      - xpack.security.transport.ssl.enabled=true
      - xpack.security.transport.ssl.key=certs/es01/es01.key
      - xpack.security.transport.ssl.certificate=certs/es01/es01.crt
      - xpack.security.transport.ssl.certificate_authorities=certs/ca/ca.crt
      - xpack.security.transport.ssl.verification_mode=certificate
      - xpack.license.self_generated.type=${LICENSE}
    mem_limit: ${MEM_LIMIT}
    ulimits:
      memlock:
        soft: -1
        hard: -1
    healthcheck:
      test:
        [
          "CMD-SHELL",
          "curl -s --cacert config/certs/ca/ca.crt https://localhost:9200 | grep -q 'missing authentication credentials'",
        ]
      interval: 10s
      timeout: 10s
      retries: 120

  es02:
    depends_on:
      - es01
    image: docker.elastic.co/elasticsearch/elasticsearch:${STACK_VERSION}
    volumes:
      - certs:/usr/share/elasticsearch/config/certs
      - esdata02:/usr/share/elasticsearch/data
    ports:
      - 19201:9200
    environment:
      - node.name=es02
      - cluster.name=${CLUSTER_NAME}
      - cluster.initial_master_nodes=es01,es02,es03
      - discovery.seed_hosts=es01,es03
      - ELASTIC_PASSWORD=${ELASTIC_PASSWORD}
      - bootstrap.memory_lock=true
      - xpack.security.enabled=true
      - xpack.security.http.ssl.enabled=true
      - xpack.security.http.ssl.key=certs/es02/es02.key
      - xpack.security.http.ssl.certificate=certs/es02/es02.crt
      - xpack.security.http.ssl.certificate_authorities=certs/ca/ca.crt
      - xpack.security.transport.ssl.enabled=true
      - xpack.security.transport.ssl.key=certs/es02/es02.key
      - xpack.security.transport.ssl.certificate=certs/es02/es02.crt
      - xpack.security.transport.ssl.certificate_authorities=certs/ca/ca.crt
      - xpack.security.transport.ssl.verification_mode=certificate
      - xpack.license.self_generated.type=${LICENSE}
    mem_limit: ${MEM_LIMIT}
    ulimits:
      memlock:
        soft: -1
        hard: -1
    healthcheck:
      test:
        [
          "CMD-SHELL",
          "curl -s --cacert config/certs/ca/ca.crt https://localhost:9200 | grep -q 'missing authentication credentials'",
        ]
      interval: 10s
      timeout: 10s
      retries: 120

  es03:
    depends_on:
      - es02
    image: docker.elastic.co/elasticsearch/elasticsearch:${STACK_VERSION}
    volumes:
      - certs:/usr/share/elasticsearch/config/certs
      - esdata03:/usr/share/elasticsearch/data
    ports:
      - 19202:9200
    environment:
      - node.name=es03
      - cluster.name=${CLUSTER_NAME}
      - cluster.initial_master_nodes=es01,es02,es03
      - discovery.seed_hosts=es01,es02
      - bootstrap.memory_lock=true
      - ELASTIC_PASSWORD=${ELASTIC_PASSWORD}
      - xpack.security.enabled=true
      - xpack.security.http.ssl.enabled=true
      - xpack.security.http.ssl.key=certs/es03/es03.key
      - xpack.security.http.ssl.certificate=certs/es03/es03.crt
      - xpack.security.http.ssl.certificate_authorities=certs/ca/ca.crt
      - xpack.security.transport.ssl.enabled=true
      - xpack.security.transport.ssl.key=certs/es03/es03.key
      - xpack.security.transport.ssl.certificate=certs/es03/es03.crt
      - xpack.security.transport.ssl.certificate_authorities=certs/ca/ca.crt
      - xpack.security.transport.ssl.verification_mode=certificate
      - xpack.license.self_generated.type=${LICENSE}
    mem_limit: ${MEM_LIMIT}
    ulimits:
      memlock:
        soft: -1
        hard: -1
    healthcheck:
      test:
        [
          "CMD-SHELL",
          "curl -s --cacert config/certs/ca/ca.crt https://localhost:9200 | grep -q 'missing authentication credentials'",
        ]
      interval: 10s
      timeout: 10s
      retries: 120

  kibana:
    depends_on:
      es01:
        condition: service_healthy
      es02:
        condition: service_healthy
      es03:
        condition: service_healthy
    image: docker.elastic.co/kibana/kibana:${STACK_VERSION}
    volumes:
      - certs:/usr/share/kibana/config/certs
      - kibanadata:/usr/share/kibana/data
    ports:
      - ${KIBANA_PORT}:5601
    environment:
      - SERVER_NAME=kibana
      #     Environment-variable mapping rules: https://www.elastic.co/guide/en/kibana/current/docker.html#environment-variable-config
      #     All configurable settings: https://www.elastic.co/guide/en/kibana/current/settings.html
      - ELASTICSEARCH_HOSTS=["https://es01:9200","https://es02:9200","https://es03:9200"]
      - ELASTICSEARCH_USERNAME=kibana_system
      - ELASTICSEARCH_PASSWORD=${KIBANA_PASSWORD}
      - ELASTICSEARCH_SSL_CERTIFICATEAUTHORITIES=config/certs/ca/ca.crt
      #      Disable Kibana monitoring collection when using Metricbeat: https://www.elastic.co/guide/en/kibana/current/monitoring-metricbeat.html
      - MONITORING_KIBANA_COLLECTION_ENABLED=false
      - XPACK_FLEET_AGENTS_ENABLED=false
    #      Preferably set this; omitting it generally still works but produces log warnings
    #    https://www.elastic.co/guide/en/kibana/current/security-settings-kb.html#security-encrypted-saved-objects-settings and surrounding sections
    #    https://www.elastic.co/guide/en/kibana/current/xpack-security-secure-saved-objects.html
    #    https://www.elastic.co/guide/en/kibana/current/kibana-encryption-keys.html
    #      - XPACK_ENCRYPTEDSAVEDOBJECTS_ENCRYPTIONKEY=387bc0129527150913edabbf649a4f52
    #      - XPACK_REPORTING_ENCRYPTIONKEY=6892fedb366bda9338ee11372885d14f
    #      - XPACK_SECURITY_ENCRYPTIONKEY=ce9e934d73da48f61b4c6c7dc899190b
    mem_limit: ${MEM_LIMIT}
    healthcheck:
      test:
        [
          "CMD-SHELL",
          "curl -s -I http://localhost:5601 | grep -q 'HTTP/1.1 302 Found'",
        ]
      interval: 10s
      timeout: 10s
      retries: 120
  filebeat:
    image: docker.elastic.co/beats/filebeat:${STACK_VERSION}
    user: root
    depends_on:
      es01:
        condition: service_healthy
      es02:
        condition: service_healthy
      es03:
        condition: service_healthy
      kibana:
        condition: service_healthy
    volumes:
      - type: bind
        source: /
        target: /hostfs
        read_only: true
      - type: bind
        source: /proc
        target: /hostfs/proc
        read_only: true
      - type: bind
        source: /sys/fs/cgroup
        target: /hostfs/sys/fs/cgroup
        read_only: true
      - type: bind
        source: /var/run/docker.sock
        target: /var/run/docker.sock
        read_only: true
      - type: volume
        source: filebeatdata
        target: /usr/share/filebeat/data
        read_only: false
      - type: bind
        source: ./filebeat.yml
        target: /usr/share/filebeat/filebeat.yml
        read_only: true
      - type: volume
        source: certs
        target: /usr/share/filebeat/config/certs
        read_only: true
    environment:
      - ELASTICS_USERNAME=elastic
      - ELASTIC_PASSWORD=${ELASTIC_PASSWORD}
      - ELASTICSEARCH_HOSTS=["https://es01:9200","https://es02:9200","https://es03:9200"]
    ports:
      - "5067:5067"
  metricbeat:
    depends_on:
      es01:
        condition: service_healthy
      es02:
        condition: service_healthy
      es03:
        condition: service_healthy
      kibana:
        condition: service_healthy
    image: docker.elastic.co/beats/metricbeat:${STACK_VERSION}
    user: root
    volumes:
      - "./metricbeat.yml:/usr/share/metricbeat/metricbeat.yml:ro"
      - "/var/run/docker.sock:/var/run/docker.sock:ro"
      - "/sys/fs/cgroup:/hostfs/sys/fs/cgroup:ro"
      - "/proc:/hostfs/proc:ro"
      - "/:/hostfs:ro"
      - certs:/usr/share/metricbeat/config/certs
      - metricbeatdata:/usr/share/metricbeat/data
    environment:
      #      The documentation recommends the built-in remote_monitoring_user
      #  https://www.elastic.co/guide/en/elasticsearch/reference/8.12/built-in-users.html
      - ELASTICS_USERNAME=elastic
      - ELASTIC_PASSWORD=${ELASTIC_PASSWORD}
      - ELASTICSEARCH_HOSTS=["https://es01:9200","https://es02:9200","https://es03:9200"]
      - KIBANA_HOST=["http://kibana:5601"]
volumes:
  certs:
    driver: local
  esdata01:
    driver: local
  esdata02:
    driver: local
  esdata03:
    driver: local
  kibanadata:
    driver: local
  metricbeatdata:
    driver: local
  filebeatdata:
    driver: local
filebeat.yml
filebeat.inputs:
  - type: filestream
    id: access-log
    paths:
      - /usr/log/access_log.txt
processors:
  - dissect:
      tokenizer: '%{client.ip} - - [%{access_timestamp}] %{response_time|integer} %{session_id} "%{http.request.method} %{url_original} %{http.version}" %{http.response.status_code|integer} %{http.response.bytes} "%{http.request.referrer}" "%{user_agent.original}"'
      field: "message"
      target_prefix: ""
      ignore_failure: false
  - if:
      contains:
        url_original: "?"
    then:
      - dissect:
          tokenizer: "%{path}?%{query}"
          field: "url_original"
          target_prefix: "url"
    else:
      - copy_fields:
          fields:
            - from: url_original
              to: url.path
          fail_on_error: false
          ignore_missing: true
  - timestamp:
      field: "access_timestamp"
      layouts:
        - "2006-01-02T15:04:05Z"
        - "2006-01-02T15:04:05.999Z"
        - "2006-01-02T15:04:05.999-07:00"
      test:
        - "2019-06-22T16:33:51Z"
        - "2019-11-18T04:59:51.123Z"
        - "2020-08-03T07:10:20.123456+02:00"
  - drop_fields:
      fields:
        [
          "agent",
          "log",
          "cloud",
          "event",
          "message",
          "log.file.path",
          "access_timestamp",
          "input",
          "url_original",
          "host",
        ]
      ignore_missing: true
  - add_tags:
      when:
        network:
          client.ip: [private, loopback]
      tags: ["private internets"]
  - replace:
      when:
        contains:
          http.response.bytes: "-"
      fields:
        - field: "http.response.bytes"
          pattern: "-"
          replacement: "0"
      ignore_missing: true
  - convert:
      fields:
        - { from: "http.response.bytes", type: "integer" }
      ignore_missing: false
      fail_on_error: false

# Reference https://www.elastic.co/guide/en/beats/filebeat/current/configuring-internal-queue.html
# queue.mem.events = number of servers * average requests per second per server * scan_frequency(10s). I think 12288 is more reasonable now
# queue.mem.events = output.worker * output.bulk_max_size
# queue.mem.flush.min_events = output.bulk_max_size
queue.mem:
  events: 12288
  flush.min_events: 4096
  flush.timeout: 1s

# Reference https://www.elastic.co/guide/en/beats/filebeat/current/configuration-general-options.html#_registry_flush
# Reduce the frequency of Filebeat refreshing files to improve performance
filebeat.registry.flush: 30s

# ILM configuration
# setup.template.settings:
#   index.number_of_shards: 1
#   index.number_of_replicas: 0
# setup.ilm.overwrite: true
# setup.ilm.policy_file: /usr/share/filebeat/filebeat-lifecycle-policy.json

# Reference https://www.elastic.co/guide/en/beats/filebeat/current/logstash-output.html
output.elasticsearch:
  hosts: ${ELASTICSEARCH_HOSTS}
  username: ${ELASTICS_USERNAME}
  password: ${ELASTIC_PASSWORD}
  loadbalance: true
  ssl.certificate_authorities: ["/usr/share/filebeat/config/certs/ca/ca.crt"]
  ssl.verification_mode: certificate
  worker: 3
  bulk_max_size: 4096
  compression_level: 3

# monitoring filebeat by Metricbeat
http.enabled: true
http.port: 5067
monitoring.enabled: false
# es cluster uuid
monitoring.cluster_uuid: "SPCG2PWsT1aLz9-WMrT-6g"
http.host: filebeat
# Reference https://www.elastic.co/guide/en/beats/filebeat/current/configuration-logging.html
# disable Filebeat logs its internal metrics, because it is already monitored by Metricbeat
logging.metrics.enabled: false
metricbeat.yml
metricbeat.config:
  modules:
    path: ${path.config}/modules.d/*.yml
    # Reload module configs as they change:
    reload.enabled: true

# Disable self-monitoring: https://www.elastic.co/guide/en/beats/metricbeat/current/configuration-monitor.html
monitoring.enabled: false
# es cluster uuid
monitoring.cluster_uuid: "SPCG2PWsT1aLz9-WMrT-6g"
http.enabled: true
http.host: 0.0.0.0
http.port: 5066

metricbeat.autodiscover:
  providers:
    - type: docker
      hints.enabled: true

# After setting hosts for each module, generally configure https://www.elastic.co/guide/en/beats/metricbeat/current/configuration-metricbeat.html#module-http-config-options
# Initially I forgot Kibana username/password, causing Error fetching data for metricset kibana.stats: passed version is not semver
metricbeat.modules:
  - module: kibana
    period: 30s
    hosts: ${KIBANA_HOST}
    username: elastic
    password: ${ELASTIC_PASSWORD}
    enabled: true
    basepath: ""
    xpack.enabled: true
  - module: elasticsearch
    period: 30s
    hosts: ${ELASTICSEARCH_HOSTS}
    username: ${ELASTICS_USERNAME}
    password: ${ELASTIC_PASSWORD}
    xpack.enabled: true
    ssl:
      enabled: true
      certificate_authorities: ["/usr/share/metricbeat/config/certs/ca/ca.crt"]
      verification_mode: "certificate"
  # Use Metricbeat to monitor itself and Filebeat
  - module: beat
    period: 30s
    hosts: ["filebeat:5067", "localhost:5066"]
    xpack.enabled: true

output.elasticsearch:
  hosts: ${ELASTICSEARCH_HOSTS}
  username: ${ELASTICS_USERNAME}
  password: ${ELASTIC_PASSWORD}
  loadbalance: true
  ssl.certificate_authorities: ["/usr/share/metricbeat/config/certs/ca/ca.crt"]
  ssl.verification_mode: certificate
logging.metrics.enabled: false
logging.level: error
Configuration Explanation and Important Points
docker-compose.yml
The Elasticsearch and Kibana configuration comes from Configure and start the cluster in the official Elasticsearch documentation.
Note: since the official file includes only Kibana, its setup service sets only the kibana_system password; see Setting kibana_system password near the end of setup. Because we also use Filebeat and Metricbeat, their users should be configured properly too. I took a shortcut and did not integrate that. Add a few lines following the kibana_system password script. Changing built-in passwords through the API
Filebeat Configuration
Readers of the preceding two articles should recognize most filebeat.yml settings.
Note: set monitoring.cluster_uuid to the Elasticsearch cluster ID, disable Filebeat self-monitoring, expose port 5067 rather than the default 5066, and use Metricbeat for unified monitoring.
Metricbeat Configuration
Metricbeat is similar to Filebeat, but requires modules for what it monitors. Here we configure the three Elasticsearch nodes, Kibana, Filebeat, and Metricbeat itself.
Note:
- Set monitoring.cluster_uuid to the Elasticsearch cluster ID. Use the default 5066 port to monitor Metricbeat itself.
- When monitoring Kibana, ensure monitoring.kibana.collection.enabled is false.
SSL Configuration
If the SSL code in setup is unclear, read this article on configuring HTTPS for ELK. It should immediately explain why the setup script is organized this way.
Note: for SSL settings when Filebeat and Metricbeat output to Elasticsearch, consult Configure > SSL and Configure > Output > Elasticsearch in their official documentation. Here, the certificates generated by setup are mounted into the containers and configured directly.
ILM Configuration
ILM settings for Filebeat and Metricbeat indexes are not repeated because the previous two articles explain them. The commented setup.ilm sections above show where to configure them.
Running the Stack
Enter src/main/resources/docker in the project and run:
docker-compose up -dNote: the first run may start only Elasticsearch and Kibana. filebeat.yml and metricbeat.yml need cluster_uuid, which I have not automated. Obtain it after startup, update both files, and rerun the command to start all components.
Screenshots
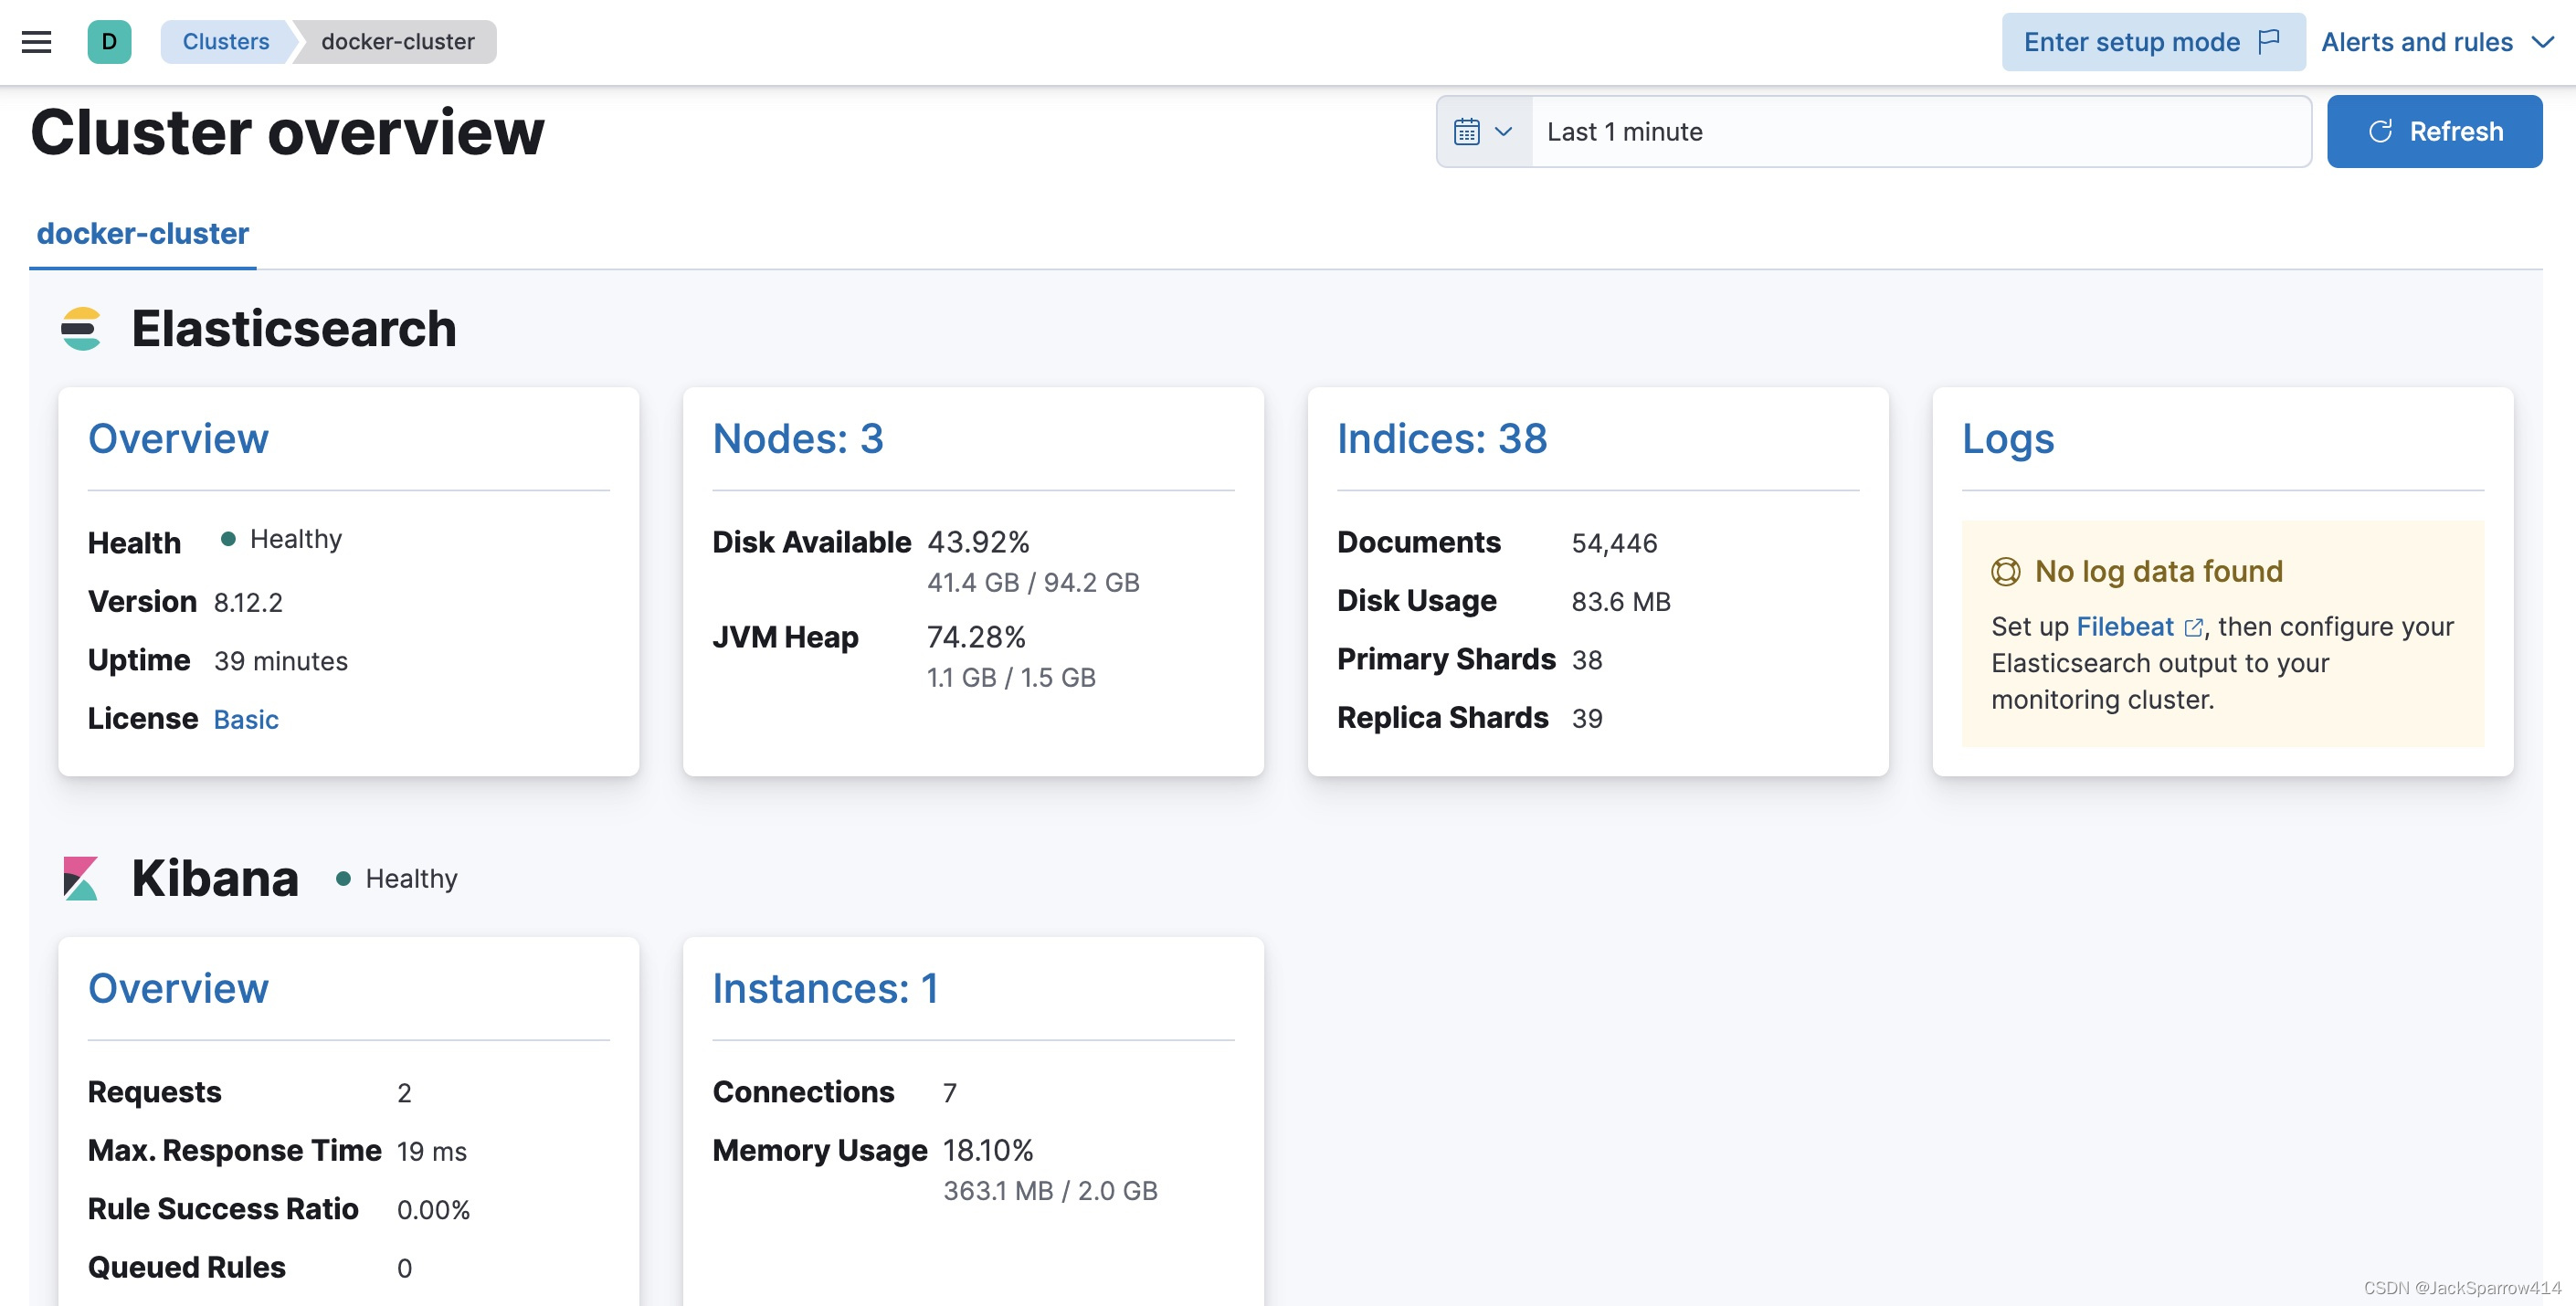 I could not take a scrolling screenshot, so here are two.
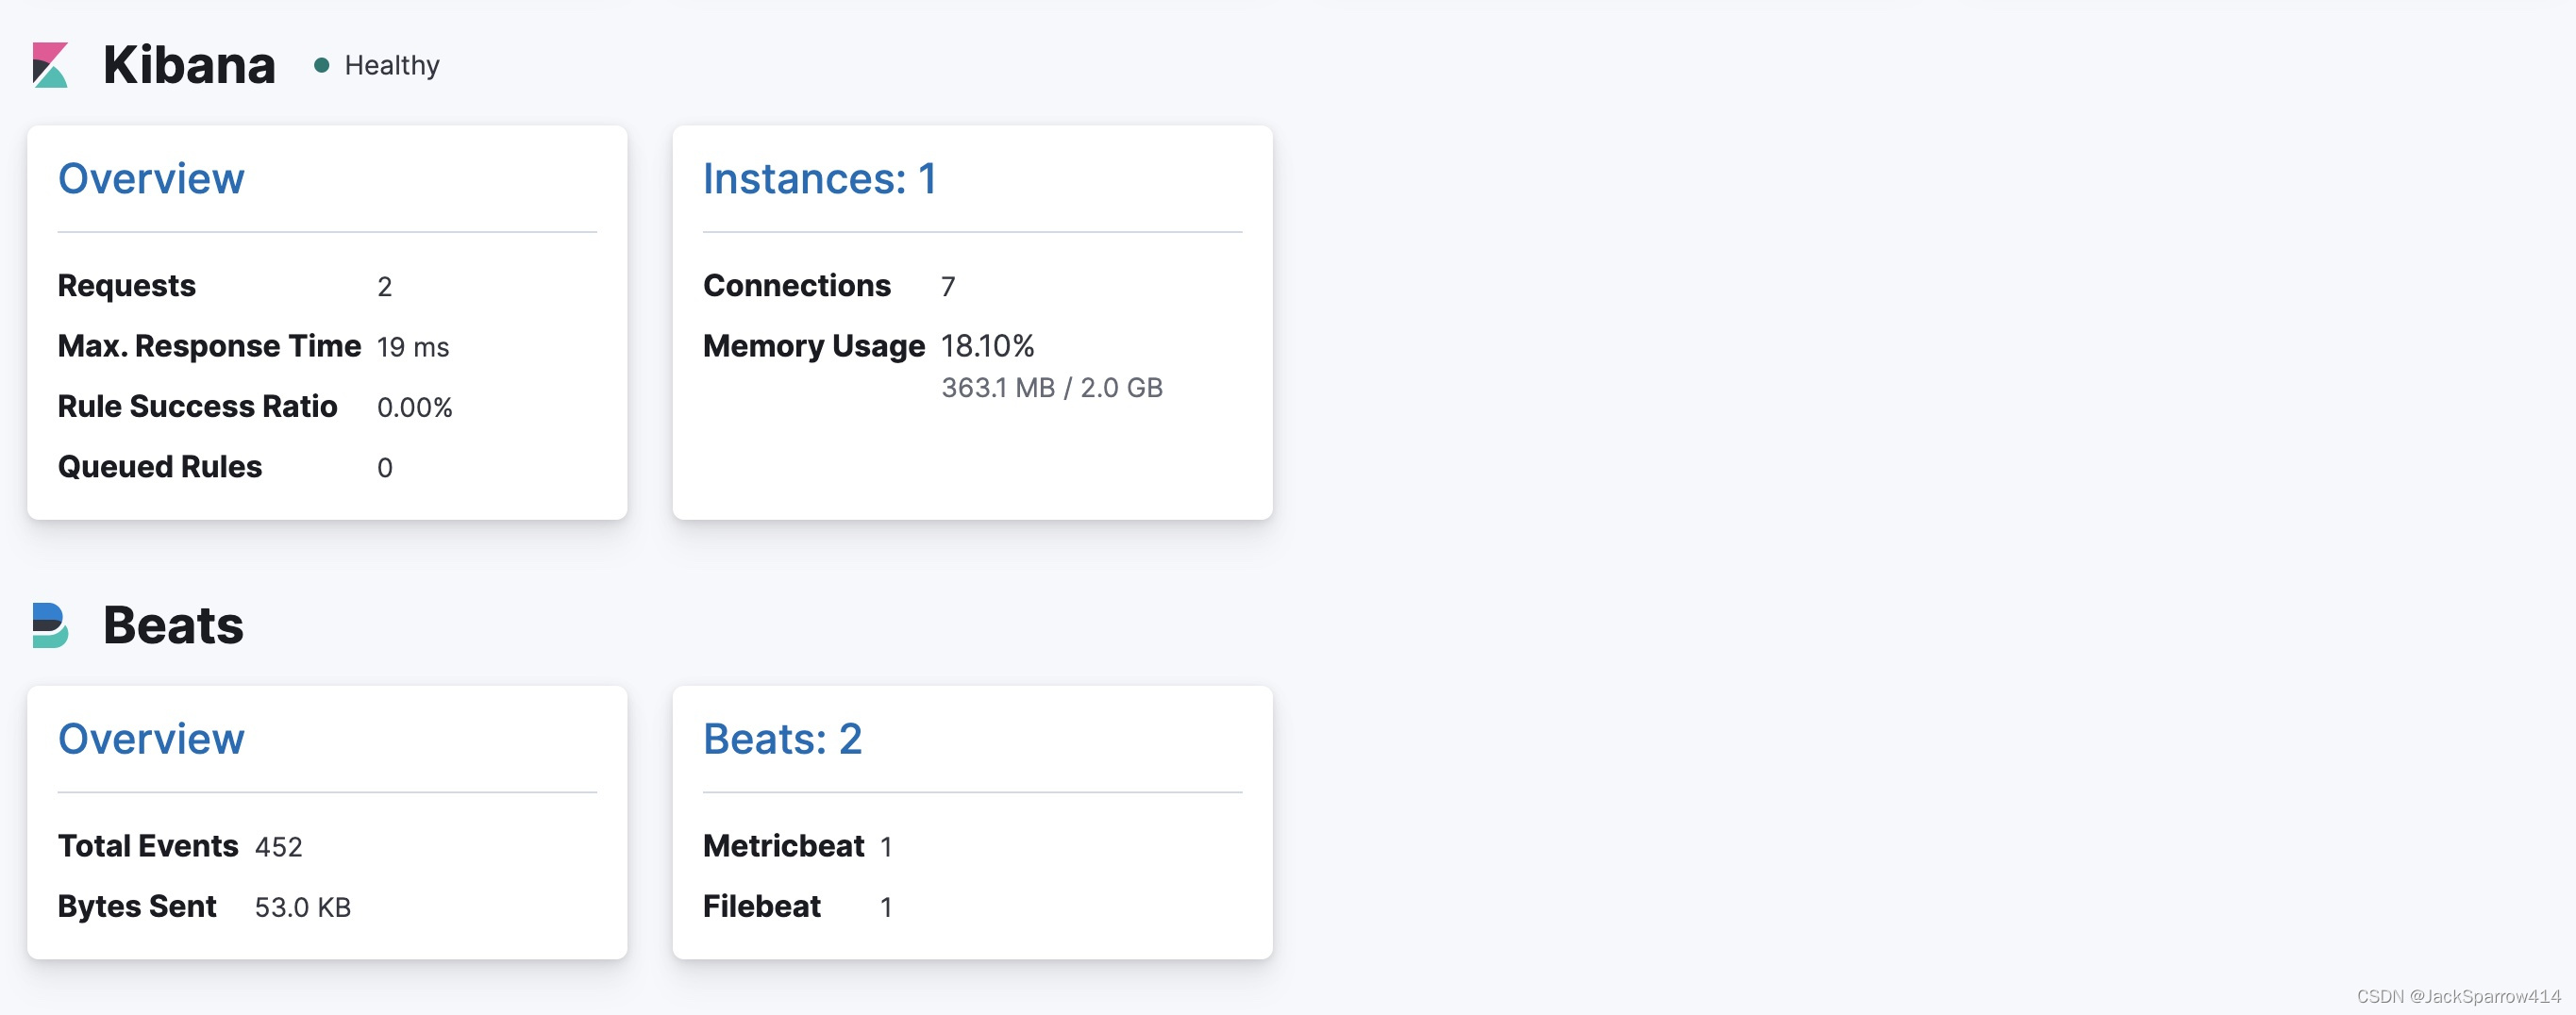 All components appear under Kibana > Stack Monitoring.
Migrating a Production Elasticsearch Single Node to a Cluster Smoothly, Without Downtime
During early trials, we used a single node to reduce costs, and the initial data came from peripheral business functions and was not especially important. As more core use cases moved to Elasticsearch, reliability and stability became crucial. With a single node already running in production, how could we switch to a cluster? We used these steps:
- Change application connections from an IP, such as 172.16.10.230, to an internal domain, es.xxx.io. Also create es1.xxx.io, es2.xxx.io, and es3.xxx.io, initially all pointing to the single node’s IP.
- After deploying the code to every server, create the production Elasticsearch cluster.
- Once it is ready, use a test server in production to verify availability and use management tools to copy the single-node data into the cluster.
- After step three passes testing, immediately change the three internal domains to the cluster IPs.
- DNS may be cached, so verify the following:
- Route 53 needs time to resolve changed domains. Lower the internal domains’ TTL; during the switch we used 10 seconds instead of the default 300.
- Java’s
java.net.InetAddressalso caches DNS, for 30 seconds by default. Seesun.net.InetAddressCachePolicy#DEFAULT_POSITIVE.
public class DnsCacheInJavaTest { private static final String TEST_DOMAIN = "avocadi.me"; /** * Rigorous Test :-) */ @Test @SneakyThrows public void dnsCacheInJava() { for (int i = 0; i < 10; i++) { try { InetAddress address = InetAddress.getByName(TEST_DOMAIN); System.out.println(getCurrentTime() + " lookup success " + address); } catch (Exception ignore) { System.out.println(getCurrentTime() + " lookup failed"); } finally { Thread.sleep(5000); } } } private static String getCurrentTime() { DateFormat dateFormat = new SimpleDateFormat("HH:mm:ss"); return dateFormat.format(Calendar.getInstance().getTime()); } }- Elasticsearch Java Client uses Apache HttpClient, whose domain resolution also relies on InetAddress. See
org.apache.http.impl.nio.conn.PoolingNHttpClientConnectionManager.InternalAddressResolver#resolveRemoteAddress. - Thus, the JVM-level DNS cache can obtain the new IP at most 30 seconds after the domain’s IP changes.
- To change JVM DNS caching, modify java.security. See this article for steps.
- However, none of this affects existing active connections. They already have TCP connections to the old Elasticsearch server and generally do not release them proactively; we verified this. After importing data into the new cluster, stop the old node to disconnect TCP and trigger the Java client’s reconnect mechanism and DNS resolution.
- How can we verify that active connections have moved to the new cluster? In production, I used tcmdump to monitor TCP connections.
First find the Elasticsearch container’s bridge:
 docker network ls | grep elastic
 # Example output: 852e06ae5a84   elastic   bridge    local
Do not resolve IP addresses and ports to names. Capture only the first 64 bytes of TCP packets without inspecting payloads, and focus on the first packet of the TCP three-way handshake.ip link show type bridge # Identify the interface matching the ID (e.g., br-852e06ae5a84)tcpdump -i br-852e06ae5a84 -nn -s 64 'dst port 9200 and not host 172.16.10.31 and tcp[tcpflags] == tcp-syn' \ | awk '{ timestamp = $1; sub(/\.[0-9]+$/, "", $3); ip = $3; if (!seen[ip]++) { printf "[%s] New Discovery: %s\n", timestamp, ip; fflush(); } }'
- This completes the transition from one node to a cluster without downtime.
Closing Thoughts
Since taking responsibility for our internal ELK deployment last year, I have gradually written up the reasoning and pitfalls. I hope these articles help you.
Although this is a reasonably substantial Elastic Stack setup, it is still short of production readiness. Remaining work includes built-in user permissions and roles, distributing and managing Elasticsearch nodes across machines, script automation, and ILM configuration. These are closely tied to real scenarios; I leave them to interested readers. My own time and energy are limited, so I will stop here.
If your company has few DevOps staff but you still want to deploy and manage Elastic Stack well, I recommend building on the open-source docker-elk project.