Table of contents
Open Table of contents
- Why Does This Feature Need Elasticsearch? Which Core Capabilities Does It Require?
- Does an Advanced Elasticsearch Feature Require a Paid License?
- How Can We Quickly Verify That Text Analysis Meets the Requirements?
- Are the Field Mappings Appropriate for the Data?
- How Should We Use Index Templates and Index Aliases?
- Can the Data Be Modified?
- How Long Must the Data Be Retained? How Should We Configure Lifecycle Management?
- How Much Will the Data Grow? What Capacity Will We Need?
- Should Production Clusters Have Different Service Tiers?
- A Real Elasticsearch Use Case and Its Optimization
- Final Thoughts
Article body
This post shares lessons from using Elasticsearch in application development. It focuses on interactions between applications and Elasticsearch; integration with other components, such as Kafka, is outside its scope.
When using Elasticsearch for a feature, I recommend treating the following points as a checklist. Adapt it to your situation, and make sure you have considered these questions before finalizing the design and implementation.
Why Does This Feature Need Elasticsearch? Which Core Capabilities Does It Require?
The first question to ask is: why am I using Elasticsearch to solve this particular problem? Where does the team’s existing technology stack fall short compared with Elasticsearch? There should be a compelling reason.
Good Examples
- The feature needs a recommendation system, and Elasticsearch’s text analysis capabilities can help implement it.
- Fuzzy queries over a large dataset are still slow after optimizing database indexes and application code. Synchronize the database data to Elasticsearch and use its powerful caching capabilities to improve fuzzy-query performance.
A Poor Example
- Elasticsearch seems capable of doing this, and many solutions online use it, so let’s use it too. This copies a solution without considering the current situation.
Does an Advanced Elasticsearch Feature Require a Paid License?
Check the official subscription information to see whether a feature requires payment.
How Can We Quickly Verify That Text Analysis Meets the Requirements?
Many Elasticsearch use cases depend on text analysis.
A common mistake is to start coding immediately, finish the surrounding application code, and only then discover problems with tokenization. Verify this critical capability at the start. Once the core text analysis works and meets the requirements, there is still plenty of time to write the code.
Choose an appropriate built-in analyzer for the requirements. Then test it with sample text in Kibana > Dev Tools; see Testing an analyzer. For example, I can test how the standard analyzer tokenizes text from our application:
POST _analyze
{
  "analyzer": "standard",
  "text": "The 2 QUICK Brown-Foxes jumped over the lazy dog's bone."
}
This approach lets you identify suitable analyzers within a few hours and discuss the results with the product team. You can determine early whether the requirement is feasible, rather than confidently promising it, writing a large amount of code, and then discovering that the core functionality cannot be implemented. That would be a trap of your own making.
What If Built-In Analysis Is Insufficient? How Do We Customize It?
Built-in analyzers may be insufficient in many situations—for example, when trying to reproduce database LIKE behavior exactly in Elasticsearch.
For custom analysis, start with these sections of the official documentation:
After creating a custom analyzer, remember the previous point: test it and confirm that it works before proceeding.
Are the Field Mappings Appropriate for the Data?
Once analysis for the core fields is working, define the complete mapping for the index. Refer to the official field data types documentation and choose types that fit the actual data. Combine this with the indexing recommendations in Tune for indexing speed and Tune for search speed to design an appropriate, efficient structure.
How Should We Use Index Templates and Index Aliases?
- I recommend using index templates and partitioning indexes according to the data’s characteristics. For example, suppose we import annual order data into Elasticsearch for fast searches and only provide searches over the past five years. Partition the indexes by year, so a date-range query searches only the relevant years rather than every index. To remove old data, delete the corresponding index directly.
- I recommend assigning an index alias, even if you do not currently use it.
Can the Data Be Modified?
If the data is written once and then only queried, with no updates—such as log data—I strongly recommend using a data stream.
How Long Must the Data Be Retained? How Should We Configure Lifecycle Management?
After creating the index structure, a key question is how long the data should remain in Elasticsearch. Machine resources are finite; we cannot store data indefinitely without limits.
The product team needs to give a clear answer. With a defined retention period, configure an index lifecycle policy appropriate to the situation. Although this could be implemented programmatically, Elasticsearch already provides the tool, so why not use it? For explanations of the lifecycle settings and a configuration example, see this post.
How Much Will the Data Grow? What Capacity Will We Need?
Before launch, estimate the volume of data Elasticsearch will hold. This helps determine whether the current hardware is sufficient and, if not, how much capacity to add. It also helps prevent sudden data growth from putting pressure on Elasticsearch and affecting other features that use it.
How should we calculate the required resources? My initial idea was to measure the storage used by one document in Elasticsearch, then multiply that by the product team’s estimated document count. I later found similar community questions whose answers said this approach was neither workable nor recommended: Elasticsearch performs various storage optimizations and compression, so this calculation is not reliable, even if we produce a number.
The only workable approach is to estimate the post-launch data volume, load that amount into Elasticsearch, observe the pressure on the system, and adjust based on the results.
Should Production Clusters Have Different Service Tiers?
As an example, our company currently has two Elasticsearch deployments in production:
- A three-node Elasticsearch cluster for critical features, whose main requirements are full-text search and high availability. Each index has one or two replicas.
- A single-node Elasticsearch deployment for platform-wide log analysis, with zero replicas. Its current configuration is four CPU cores and 16 GB of memory, supporting 60–70 GB of access_log data. It may become a cluster once catalina.out is included.
Cluster tiers: divide Elasticsearch clusters into high-priority and low-priority groups. Critical features use the high-priority clusters, with load kept low and one replica per index to tolerate a single-node failure. Noncritical features use the low-priority clusters, with higher load and zero replicas per index.
The passage above is quoted from The evolution of iQIYI’s data-lake-based logging platform architecture. Our approach is broadly similar.
A Real Elasticsearch Use Case and Its Optimization
Background
A feature needed to record user behavior during purchases: visiting the purchase page, passing a human verification check, choosing products, adding items to the cart, removing items, and making payments. Analyzing these logs would help us improve the various sales settings.
We decided to submit logging tasks asynchronously to a thread pool and write them to Elasticsearch through the Elasticsearch Java Client. Depending on the scenario, some log entries might also be updated during this process.
Since the deployment only needed to receive logs, the production Elasticsearch instance had two CPU cores, 16 GB of memory, and a few dozen gigabytes of disk space.
Heavy Writes Slow Elasticsearch and Overwhelm the Application Servers
One month after launch, the application servers suddenly raised numerous alerts: thread pools were exhausted and response times had increased substantially. At the same time, Elasticsearch CPU usage rose to 80% and remained there.
Emergency Mitigation
The production application servers were responding slowly and some normal operations were already affected. We immediately deployed a patch that controlled whether logs were written to Elasticsearch, then temporarily disabled those writes.
Investigation
After the emergency fix, we investigated the problem. Reviewing the relevant code and the log index configuration revealed several issues:
- The incident’s timing pointed to a scheduled task. It periodically removed expired logs using delete_by_query.
- Although the data was clearly log data, the developers had not used a data stream. Instead, all records were put into one index, which had grown to about 30 GB by the time of the incident.
- Running delete_by_query with that Elasticsearch configuration drove CPU usage up. Meanwhile, the application servers kept sending log writes, increasing the burden and creating a vicious cycle.
- Although writes were asynchronous, they used a shared thread pool used throughout the application. The large volume of writes filled both the pool and its waiting queue. Our custom shared pool’s rejection policy blocked the submitting thread when the queue was full and the maximum thread count had been reached. This left application-server threads blocked, causing slow responses and a sharp drop in performance.
Fixes
- Have the developers change the index configuration to use a data stream for automatic management and removal of expired logs. For more on data streams, see this post.
- Prohibit delete_by_query on indexes containing large datasets. If a data stream cannot be used, partition the data by an appropriate criterion and write different partitions to separate indexes, reducing the size of each index.
- Integrate a circuit breaker with the Elasticsearch Java Client. When responses are slow or the failure rate reaches a threshold, open the circuit so subsequent tasks fail quickly and release their threads.
- We use Resilience4j for the circuit breaker.
- During initialization of the Elasticsearch Java Client, use Byte Buddy to create a dynamic proxy that integrates Resilience4j and monitors all client methods.
After deployment, Elasticsearch handled periodic removal of expired logs, and we no longer saw CPU spikes caused by log cleanup. When Elasticsearch responds slowly, the circuit breaker opens, protecting the application servers’ core functionality.
Large Bursts of Log Writes Drive Up Elasticsearch CPU Usage
After fixing the first problem, we continued monitoring. We found that large bursts of log writes still drove up Elasticsearch CPU usage.
Investigation
- Reviewing the logging logic showed that each write was immediately followed by an update_by_query query.
Fixes
-
First, specify the index names. The previous fix had changed the index to a data stream, but queries and updates still searched the entire stream, which was unnecessary. These logs concern current activity, so updates target the current day’s logs. We therefore asked the developers to query only three backing indexes: the previous day’s, the current day’s, and the following day’s.
-
Change the index’s refresh_interval to 30s.
-
Use the bulk API for writes. Since multiple threads write logs, collect their records in one place and write them in batches. I remembered that Kafka supports batching, examined its source, and found an approach:
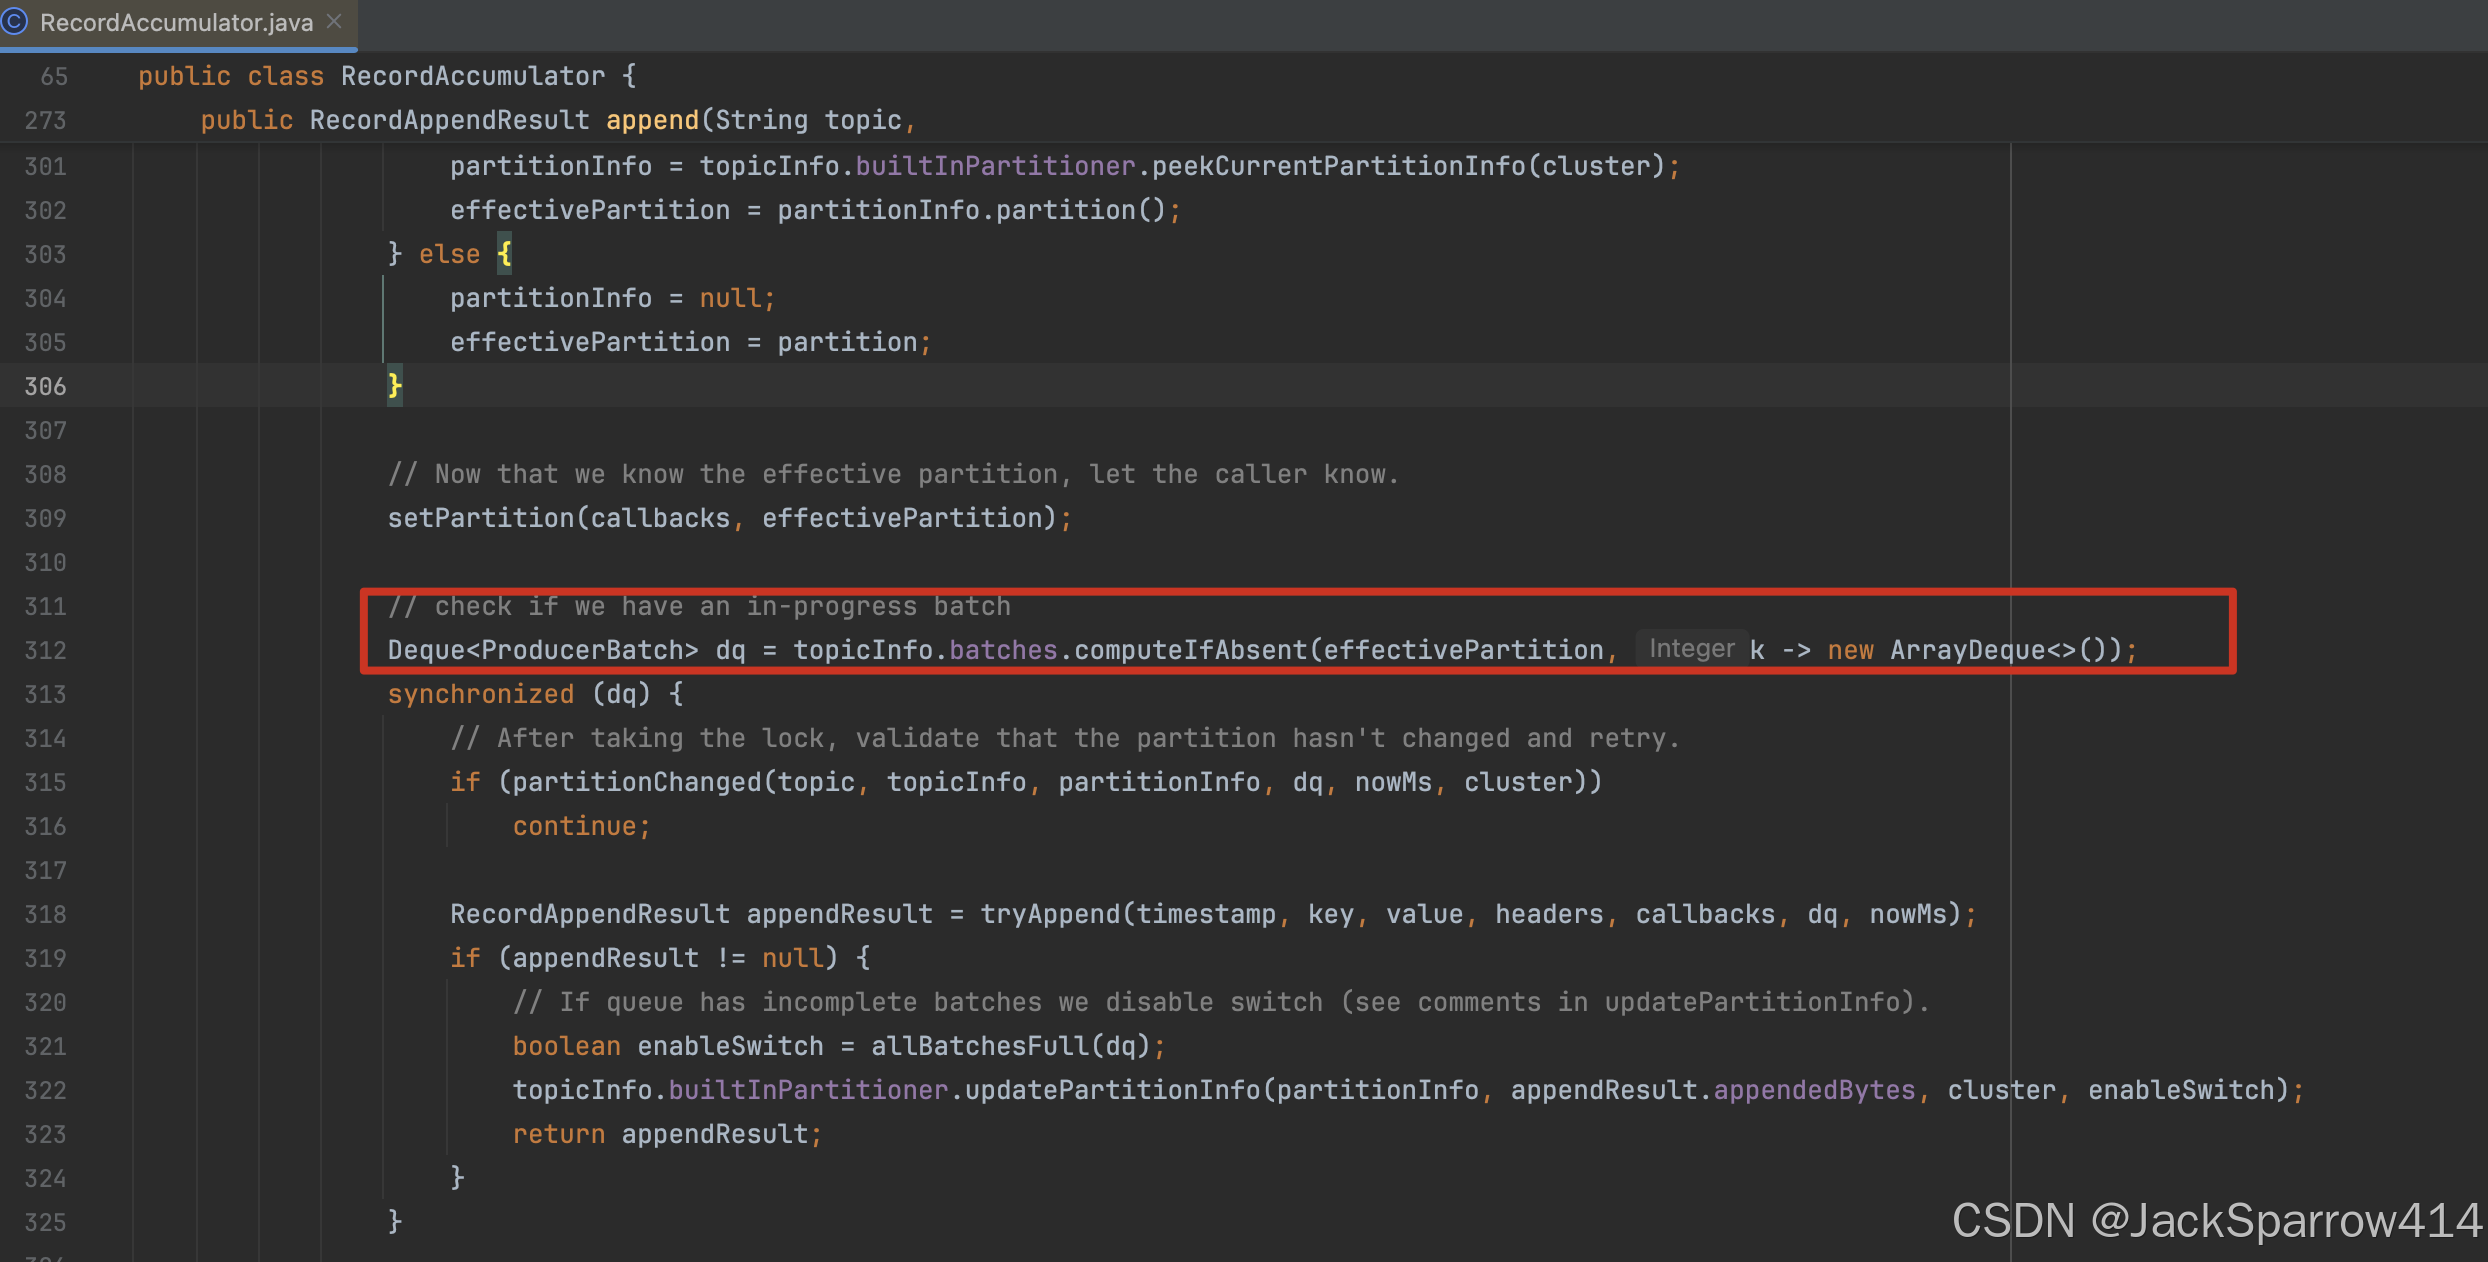
- Use a queue. All concurrent writes first enqueue their records. We use ConcurrentLinkedQueue to make concurrent enqueuing safe.
- A scheduled task consumes the queued logs every 30s and writes them to Elasticsearch through the bulk API.
- This substantially improves write performance. The producer threads only enqueue data, which is very fast, and only one scheduled-task thread performs the actual writes.
-
After batching writes, we also optimized the update logic to use batching.
After deployment, even large bursts of logs no longer affected Elasticsearch’s stability. CPU usage dropped from the usual 40%–60% to below 5%.
Final Thoughts
These are all points to consider when developing features with Elasticsearch. I have not written out every solution in detail because the linked official documentation provides the implementation steps.
In practice, coding often begins only after most of these questions have been settled.
If you have better development practices, feel free to discuss them in the comments.