Table of contents
Open Table of contents
Setting Up ELK and Getting Started
Introduction
- Elasticsearch, Logstash, and Kibana are all version 7.13.
- Our scenario is searching a collection of articles. Start with a scenario and gradually expand it to prompt learning about ELK. I find this faster than reading documentation without a purpose: learning with questions in mind is more effective.
- I will describe my thinking while learning ELK, in the hope that it helps you approach other technologies later.
- On Windows, I recommend PowerShell.
Defining the Data Format
The basic article structure is:
{
  "title": "Article title—string",
  "author": "Author name—string",
  "article_content": "Article body—string",
  "article_genre": "Article genre—string; multiple values are allowed, so this field is an array",
  "chines": "Whether the article is Chinese—boolean",
  "reading_count": "Article read count—numeric",
  "created": "Article creation time—date",
  "updated": "Article update time—date"
}
Installation and Startup
Find Windows installation instructions on the official sites. Here are the Elasticsearch Windows instructions; consult the documentation for the other two components.
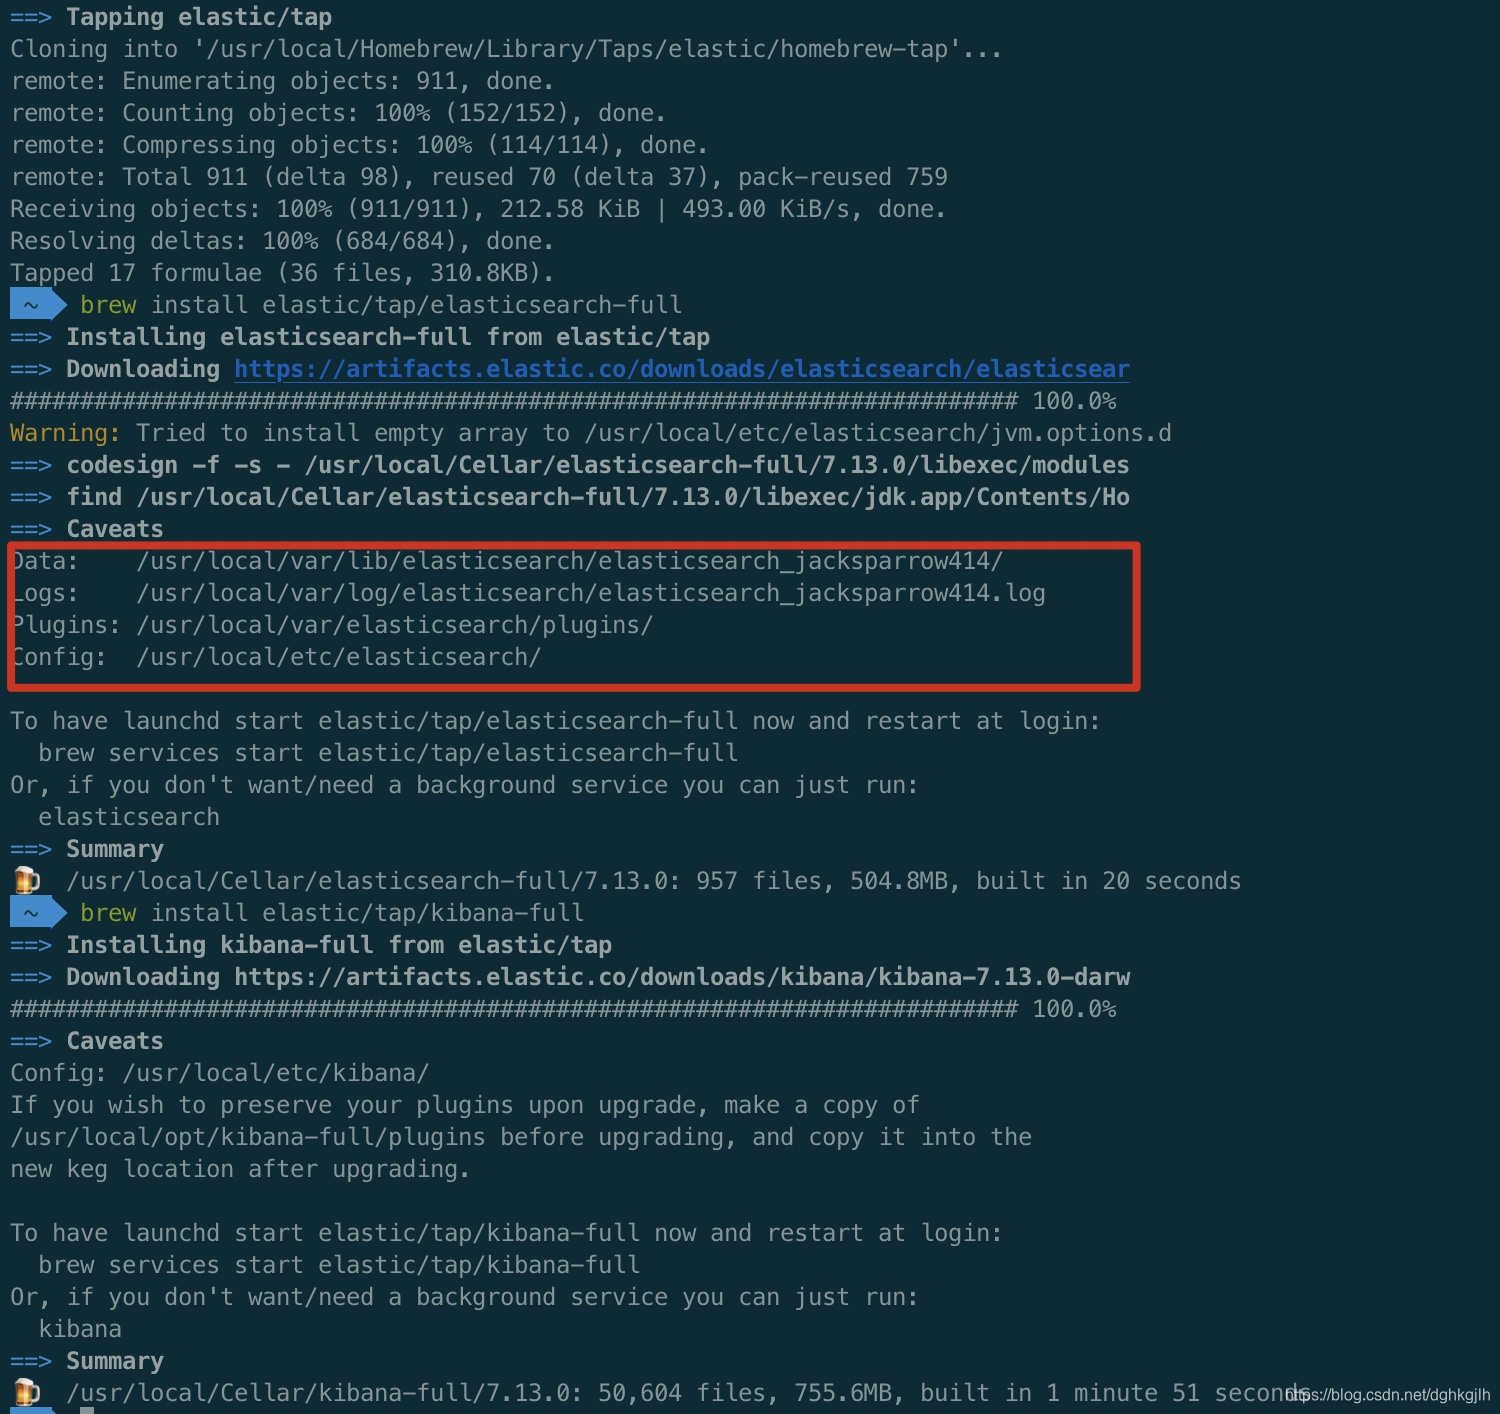
brew tap elastic/tap

brew install elastic/tap/elasticsearch-full

brew install elastic/tap/kibana-full

brew install elastic/tap/logstash-full
Starting Elasticsearch
The default port is 9200.
brew service start elasticsearchWait a moment.
Output similar to the following indicates successful startup.
{
  "name" : "duhongbodeMacBook-Pro.local",
  "cluster_name" : "elasticsearch_jacksparrow414",
  "cluster_uuid" : "rp73VaY8RRCgQrl4M5uR9A",
  "version" : {
    "number" : "7.7.1",
    "build_flavor" : "default",
    "build_type" : "tar",
    "build_hash" : "ad56dce891c901a492bb1ee393f12dfff473a423",
    "build_date" : "2020-05-28T16:30:01.040088Z",
    "build_snapshot" : false,
    "lucene_version" : "8.5.1",
    "minimum_wire_compatibility_version" : "6.8.0",
    "minimum_index_compatibility_version" : "6.0.0-beta1"
  },
  "tagline" : "You Know, for Search"
}
Starting Kibana
Before startup, configure the port and host in kibana.yml, located in /usr/local/etc/kibana.
brew service start kibanaVisit localhost:5601 in a browser.
Starting Logstash
Configuring first-pipeline.conf
input {
  2     stdin {

        }
  5 }
  6
  7 output {
  8     elasticsearch {
  9         hosts => [ "localhost:9200" ]
 10         user => "elastic"
 11         password => "password"
 12     }
 13 }
Starting Logstash in the Foreground
Enter the Logstash configuration directory:
cd /usr/local/etc/logstashNot sure where it is? See Logstash directory layout.
Start it with the first-pipeline configuration file:
logstash -f first-pipeline.conf --config.reload.automaticUse CTRL-D to stop foreground Logstash.
Installing Logstash Plugins
For plugin installation, see the official documentation and Logstash plugin list.
Configuring Basic Security
Without security configuration, Kibana prompts you to configure it when logging in.
For development, the minimal security setup is sufficient.
Configuring Elasticsearch Credentials
Credential configuration documentation
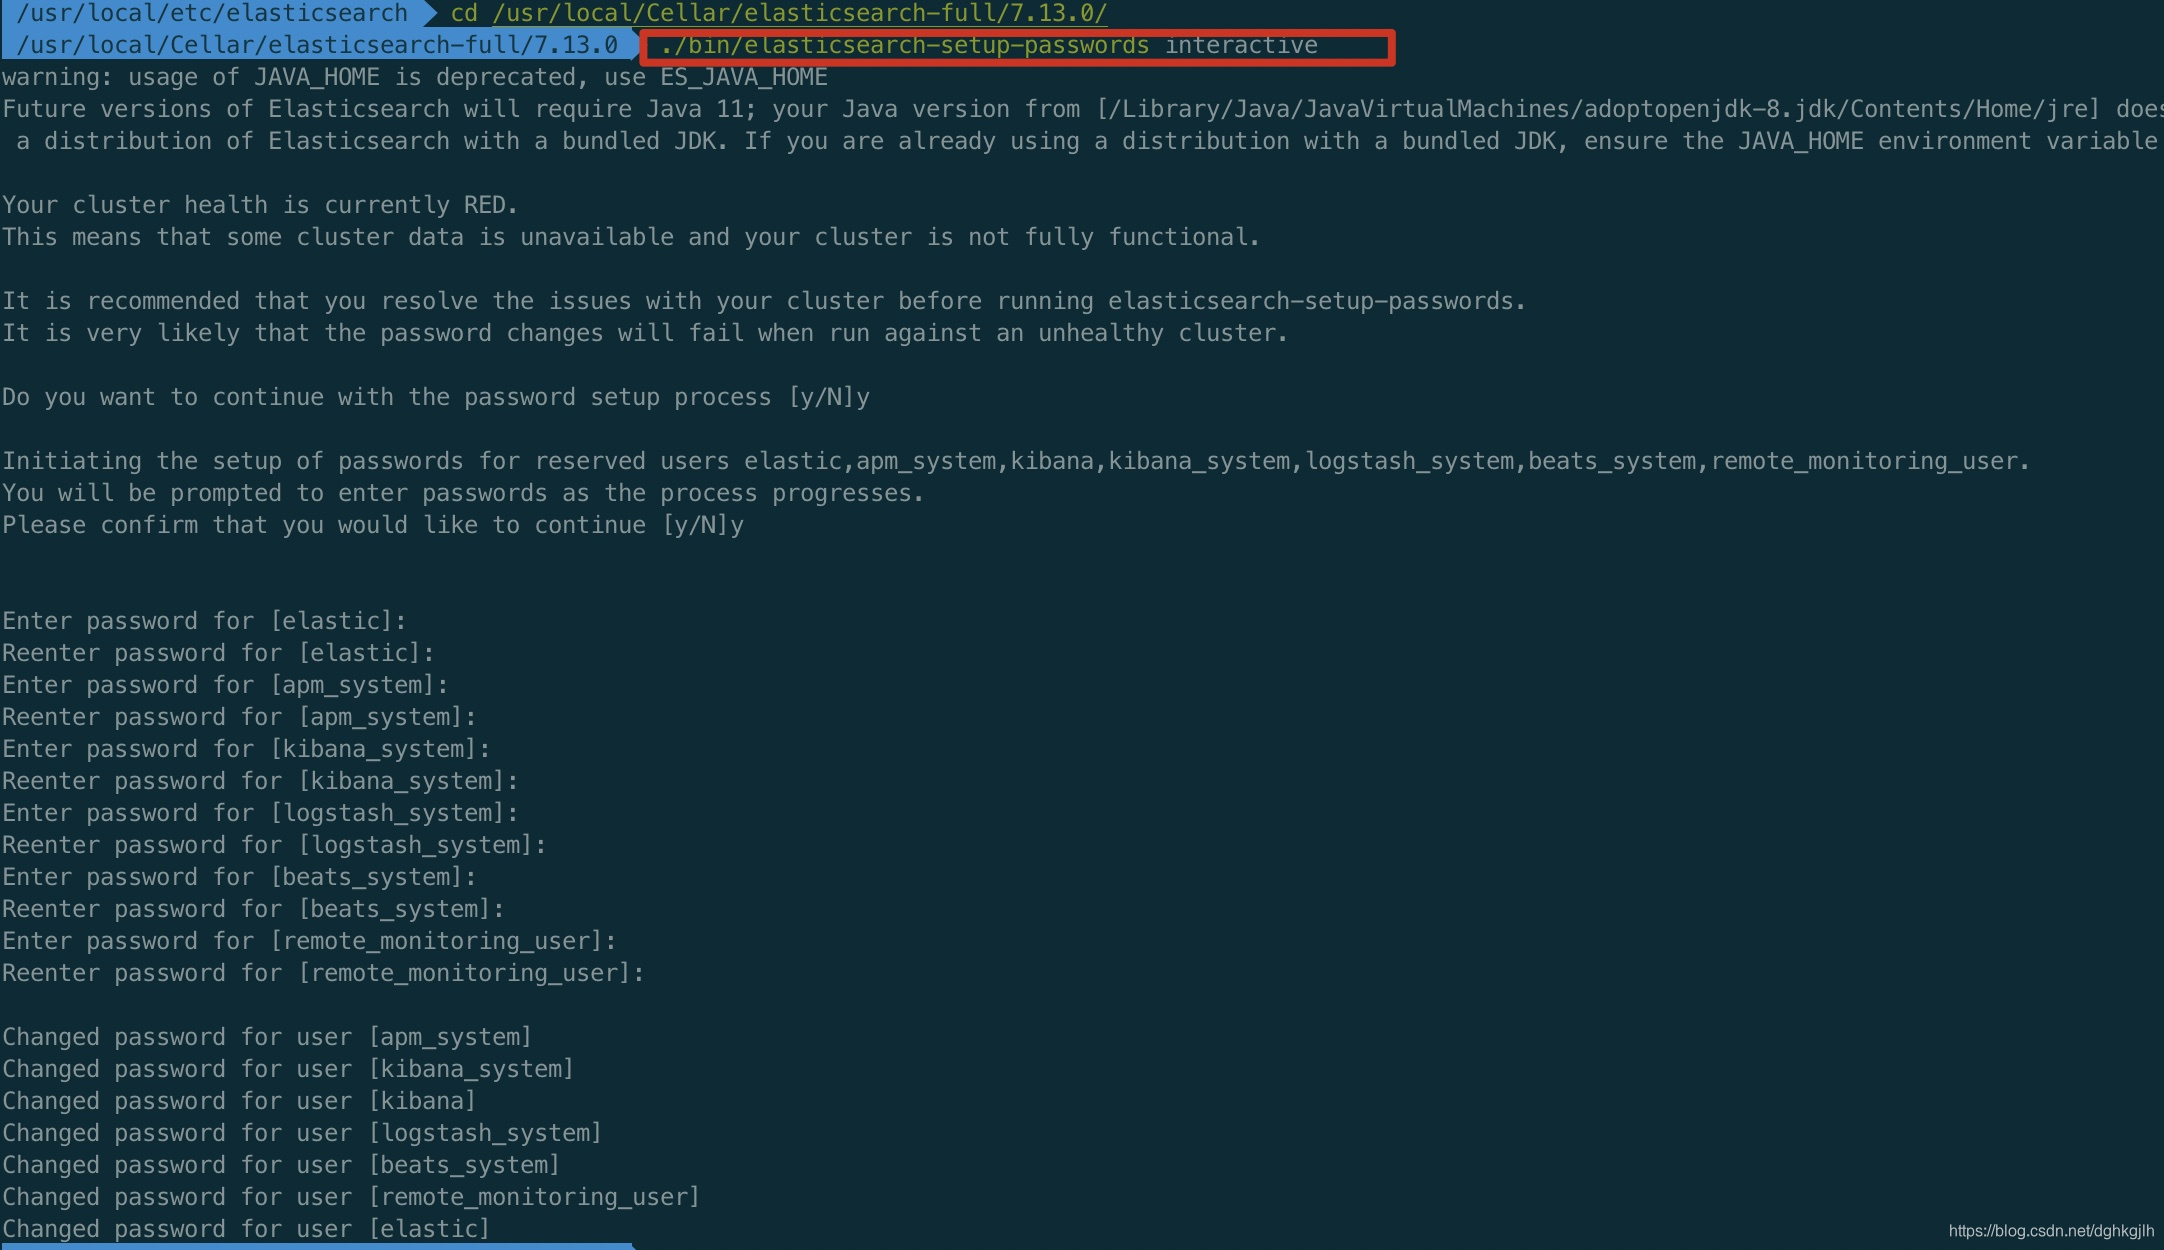
Here, all passwords are set to password.
Configuring Kibana Security
Uncomment the Elasticsearch-related username setting in kibana.yml.
See the official documentation for subsequent steps.
Logging In After Configuration
Visit kibana.localhost:5601 and log in with username elastic and password password.
Logging In to Kibana
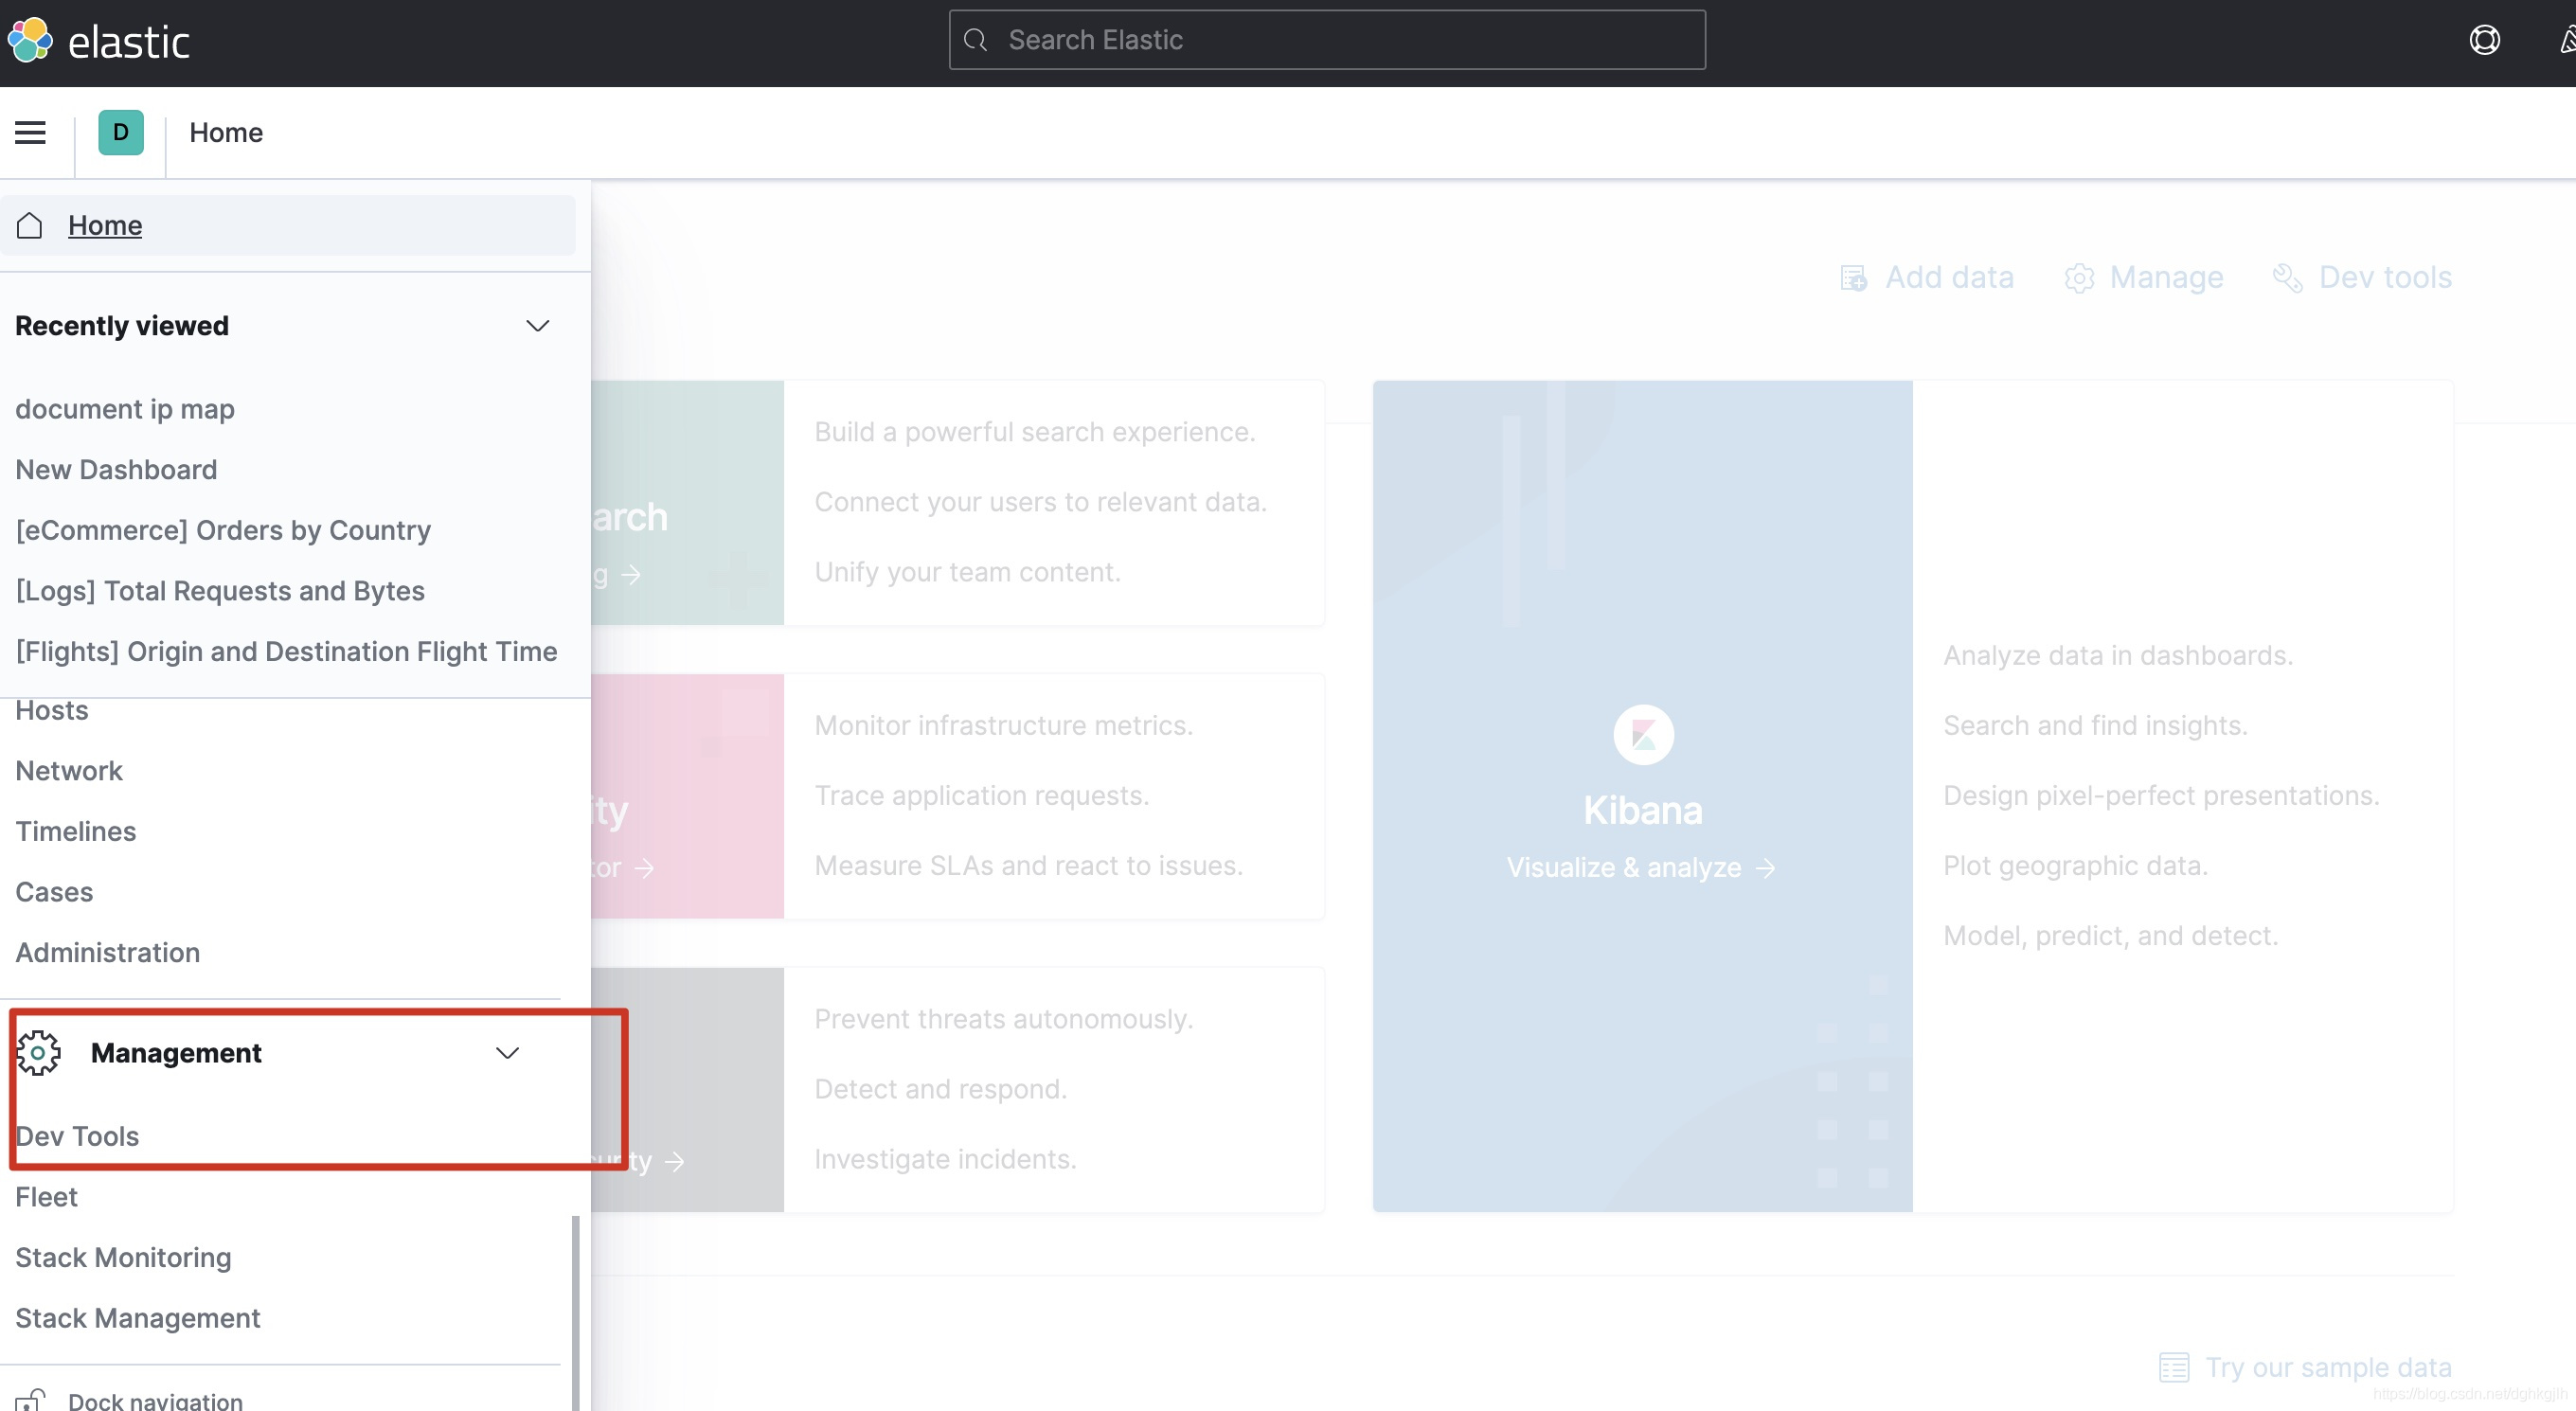
After login, open Dev Tools. This graphical panel is convenient for Elasticsearch REST operations and provides completion hints.
Creating Data in Elasticsearch
Creating an Index
If you know Solr, an Elasticsearch index is roughly like a Solr core: a collection of data with similar structures. Why similar rather than identical? Because the structure within an index can be adjusted dynamically according to type. We will not go deeply into this in an introductory article.
Note: you can write data without creating an index, and Elasticsearch will create one dynamically if absent. Here, however, we create the index first.
First define the index and its data structure in Kibana’s Management -> Dev Tools.
PUT /my-articles
{
  "mappings": {
    "properties": {
       "title": {
          "type": "text"
       },
        "author": {
          "type": "text"
       },
        "article_content": {
          "type": "text"
       },
        "article_genre": {
          "type": "text"
       },
        "chinese": {
          "type": "boolean"
       },
        "reading_count": {
          "type": "integer"
       },
        "created": {
          "type": "date",
          "format": "yyyy-MM-dd HH:mm:ss"
       },
        "updated": {
          "type": "date",
          "format": "yyyy-MM-dd HH:mm:ss"
       }
    }
  },
  "settings": {
    "index": {
       "number_of_shards": 1,
       "number_of_replicas": 1
    }
  },
  "aliases": {

  }
}-
Use PUT followed by the index name. Index names must be lowercase. Detailed naming rules
-
The request body contains mappings for the data structure, settings for shard and replica counts, and aliases. I have not studied aliases yet; I leave features outside the current scenario for later.
-
Under mappings, properties defines the individual fields and their types, in this format:
"FIELD_NAME": {
    "type": "FIELD_TYPE"
}
The mappings above follow our initial data format: text for strings, boolean for booleans, date for dates, and integer for numbers. More types are in the official field-type documentation.
Inspecting the Created Index
After creating it, the first thing I want to do is inspect its complete structure.
GET /my-articles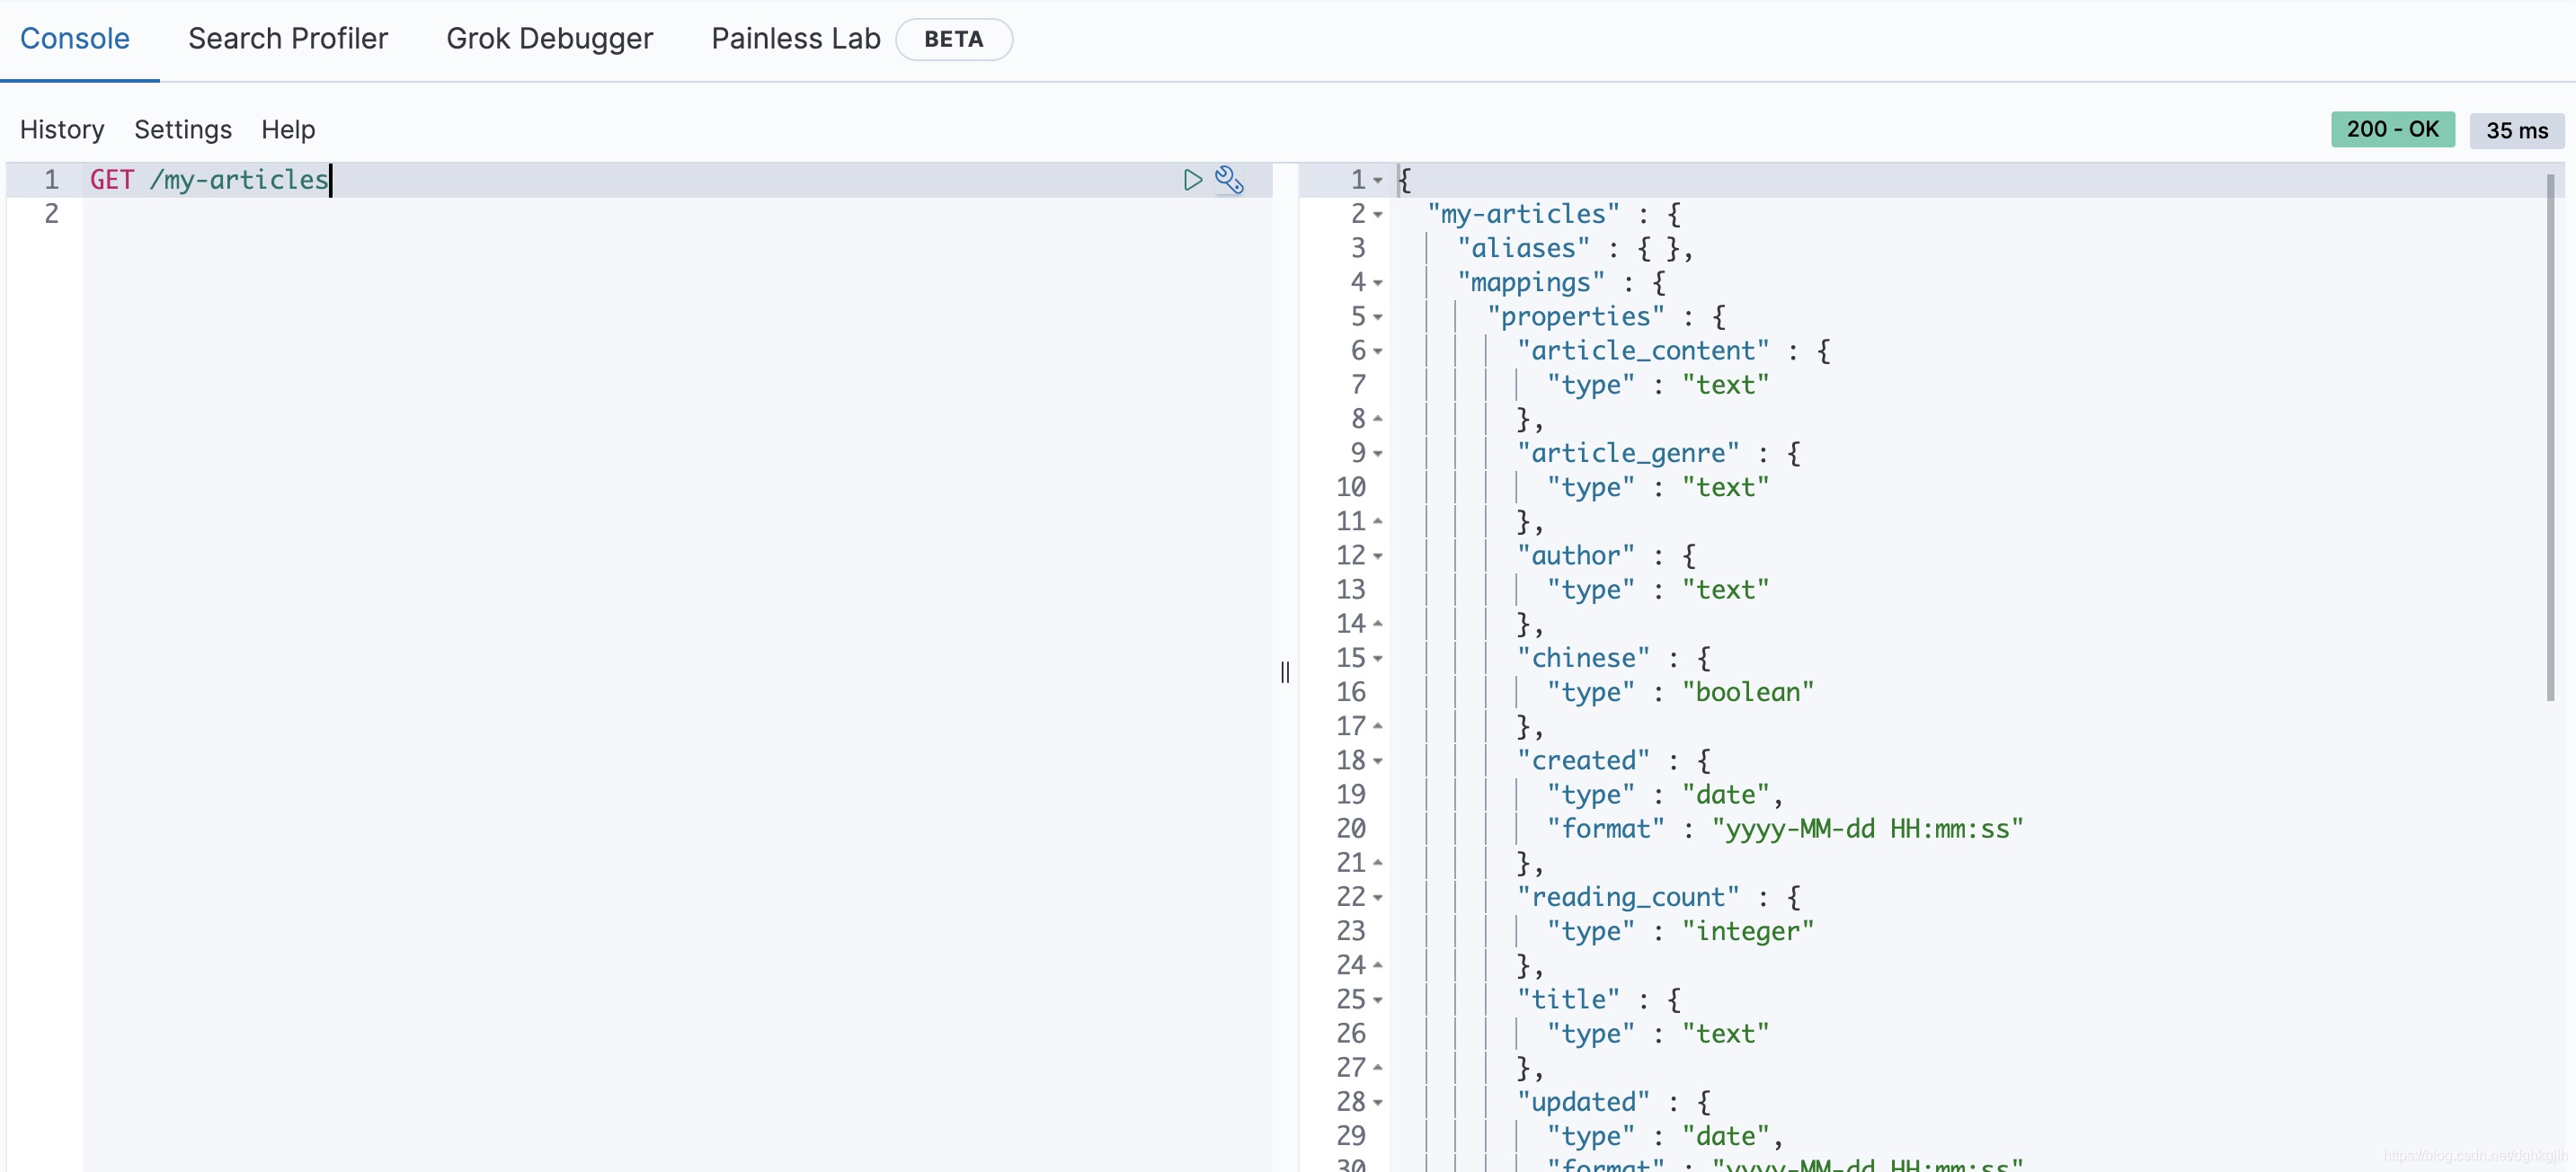
Inspecting the Mappings
View only the mappings structure:
GET /my-articles/_mappingInspecting a Field’s Type
Inspect the author field’s type:
GET /my-articles/_mapping/field/author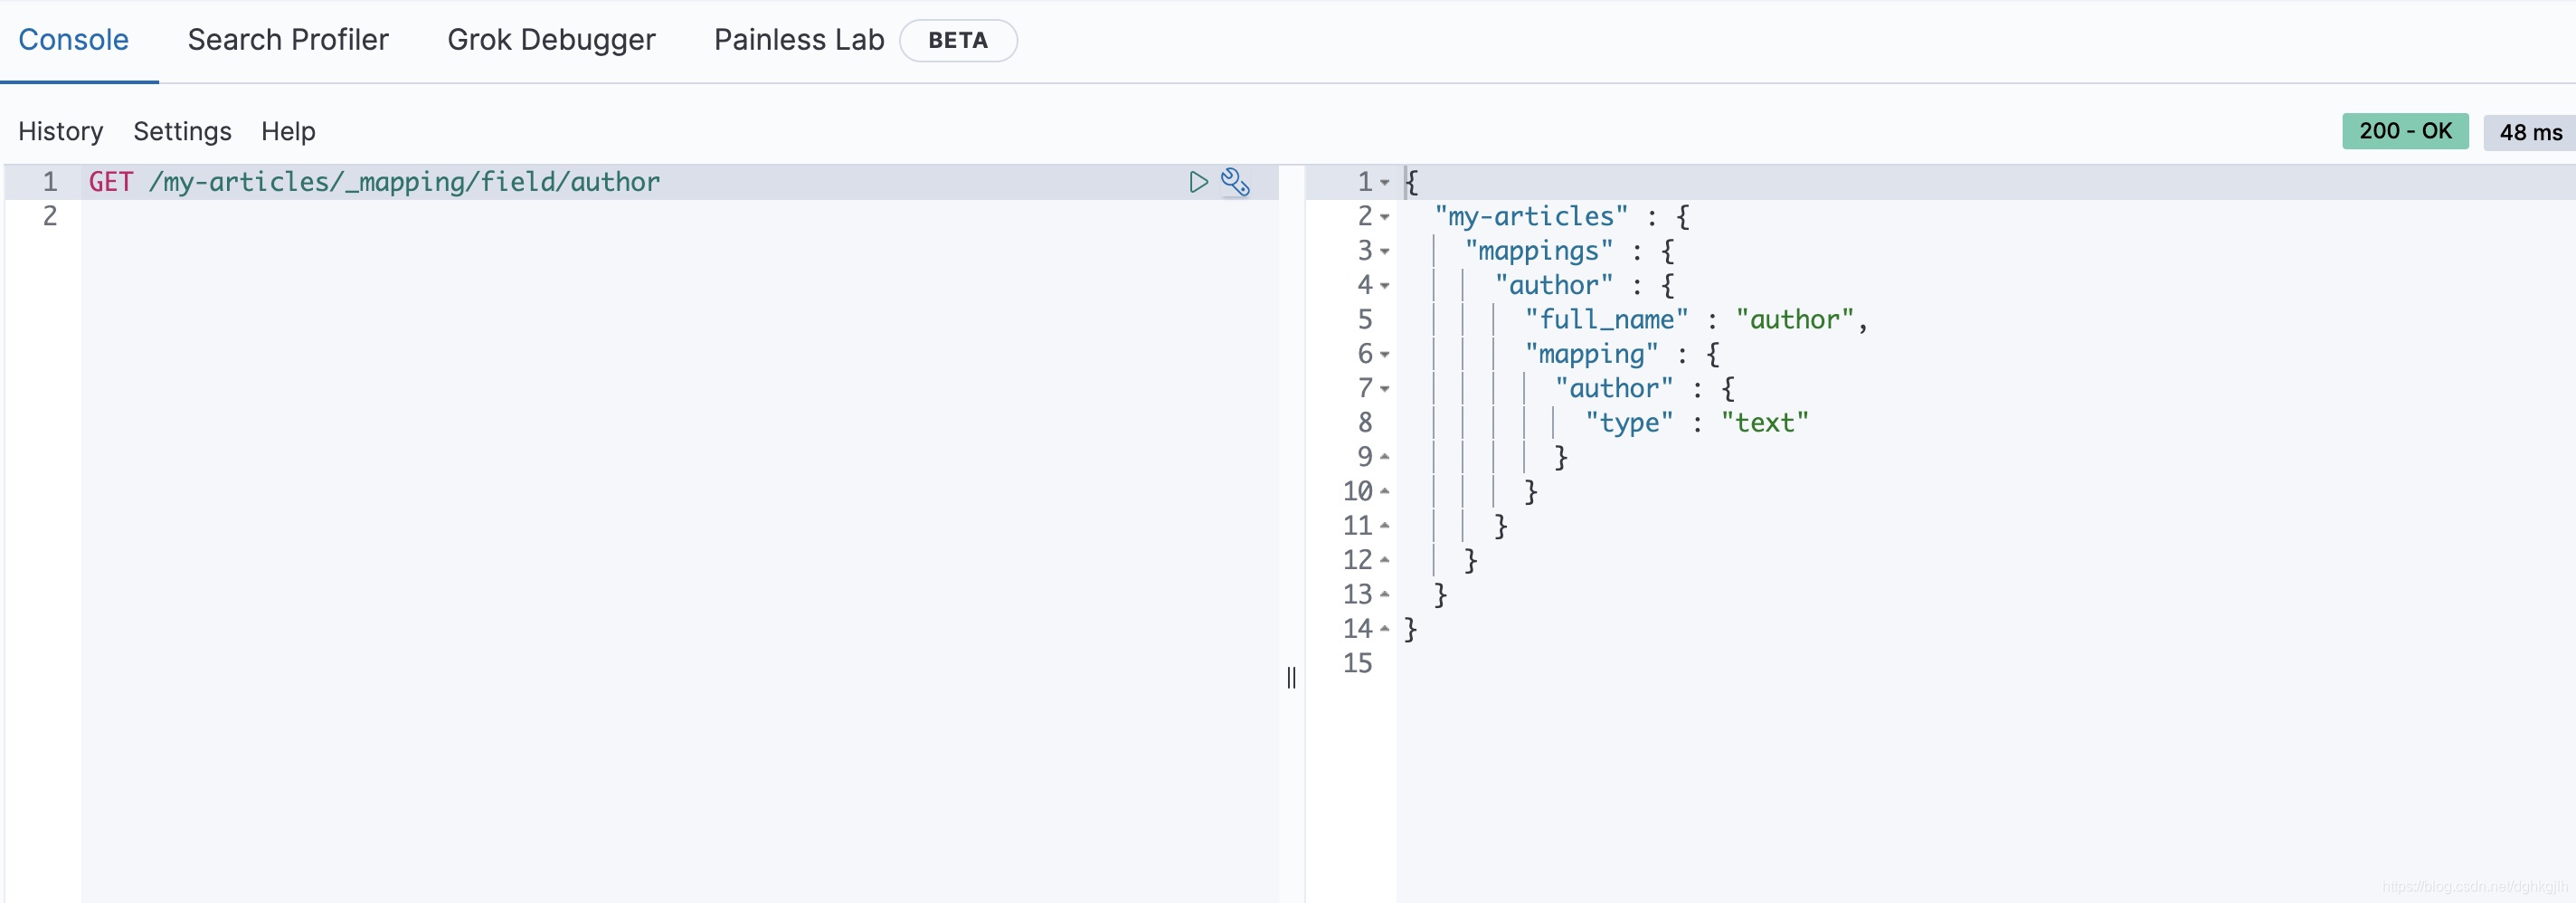
Creating Data
After defining the structure, add data. Indexing documentation
POST /my-articles/_doc
{
  "title": "青玉案·元夕",
  "author": "辛弃疾",
  "article_content":"东风夜放花千树,更吹落、星如雨。宝马雕车香满路。凤箫声动,玉壶光转,一夜鱼龙舞。蛾儿雪柳黄金缕,笑语盈盈暗香去。众里寻他千百度,蓦然回首,那人却在,灯火阑珊处。",
  "article_genre": ["古词","记叙文"],
  "reading_count": 25,
  "chinese": true,
  "created": "2021-06-03 19:27:56",
  "updated": "2021-06-03 19:27:56"
}
You can either specify an ID when creating data or let Elasticsearch generate one. We use the second approach.
Displaying Data in Kibana
Use Discover to view data in Kibana, but first create an index pattern.
Creating Index Patterns
Management->Stack Management->Kibana->Index Patterns
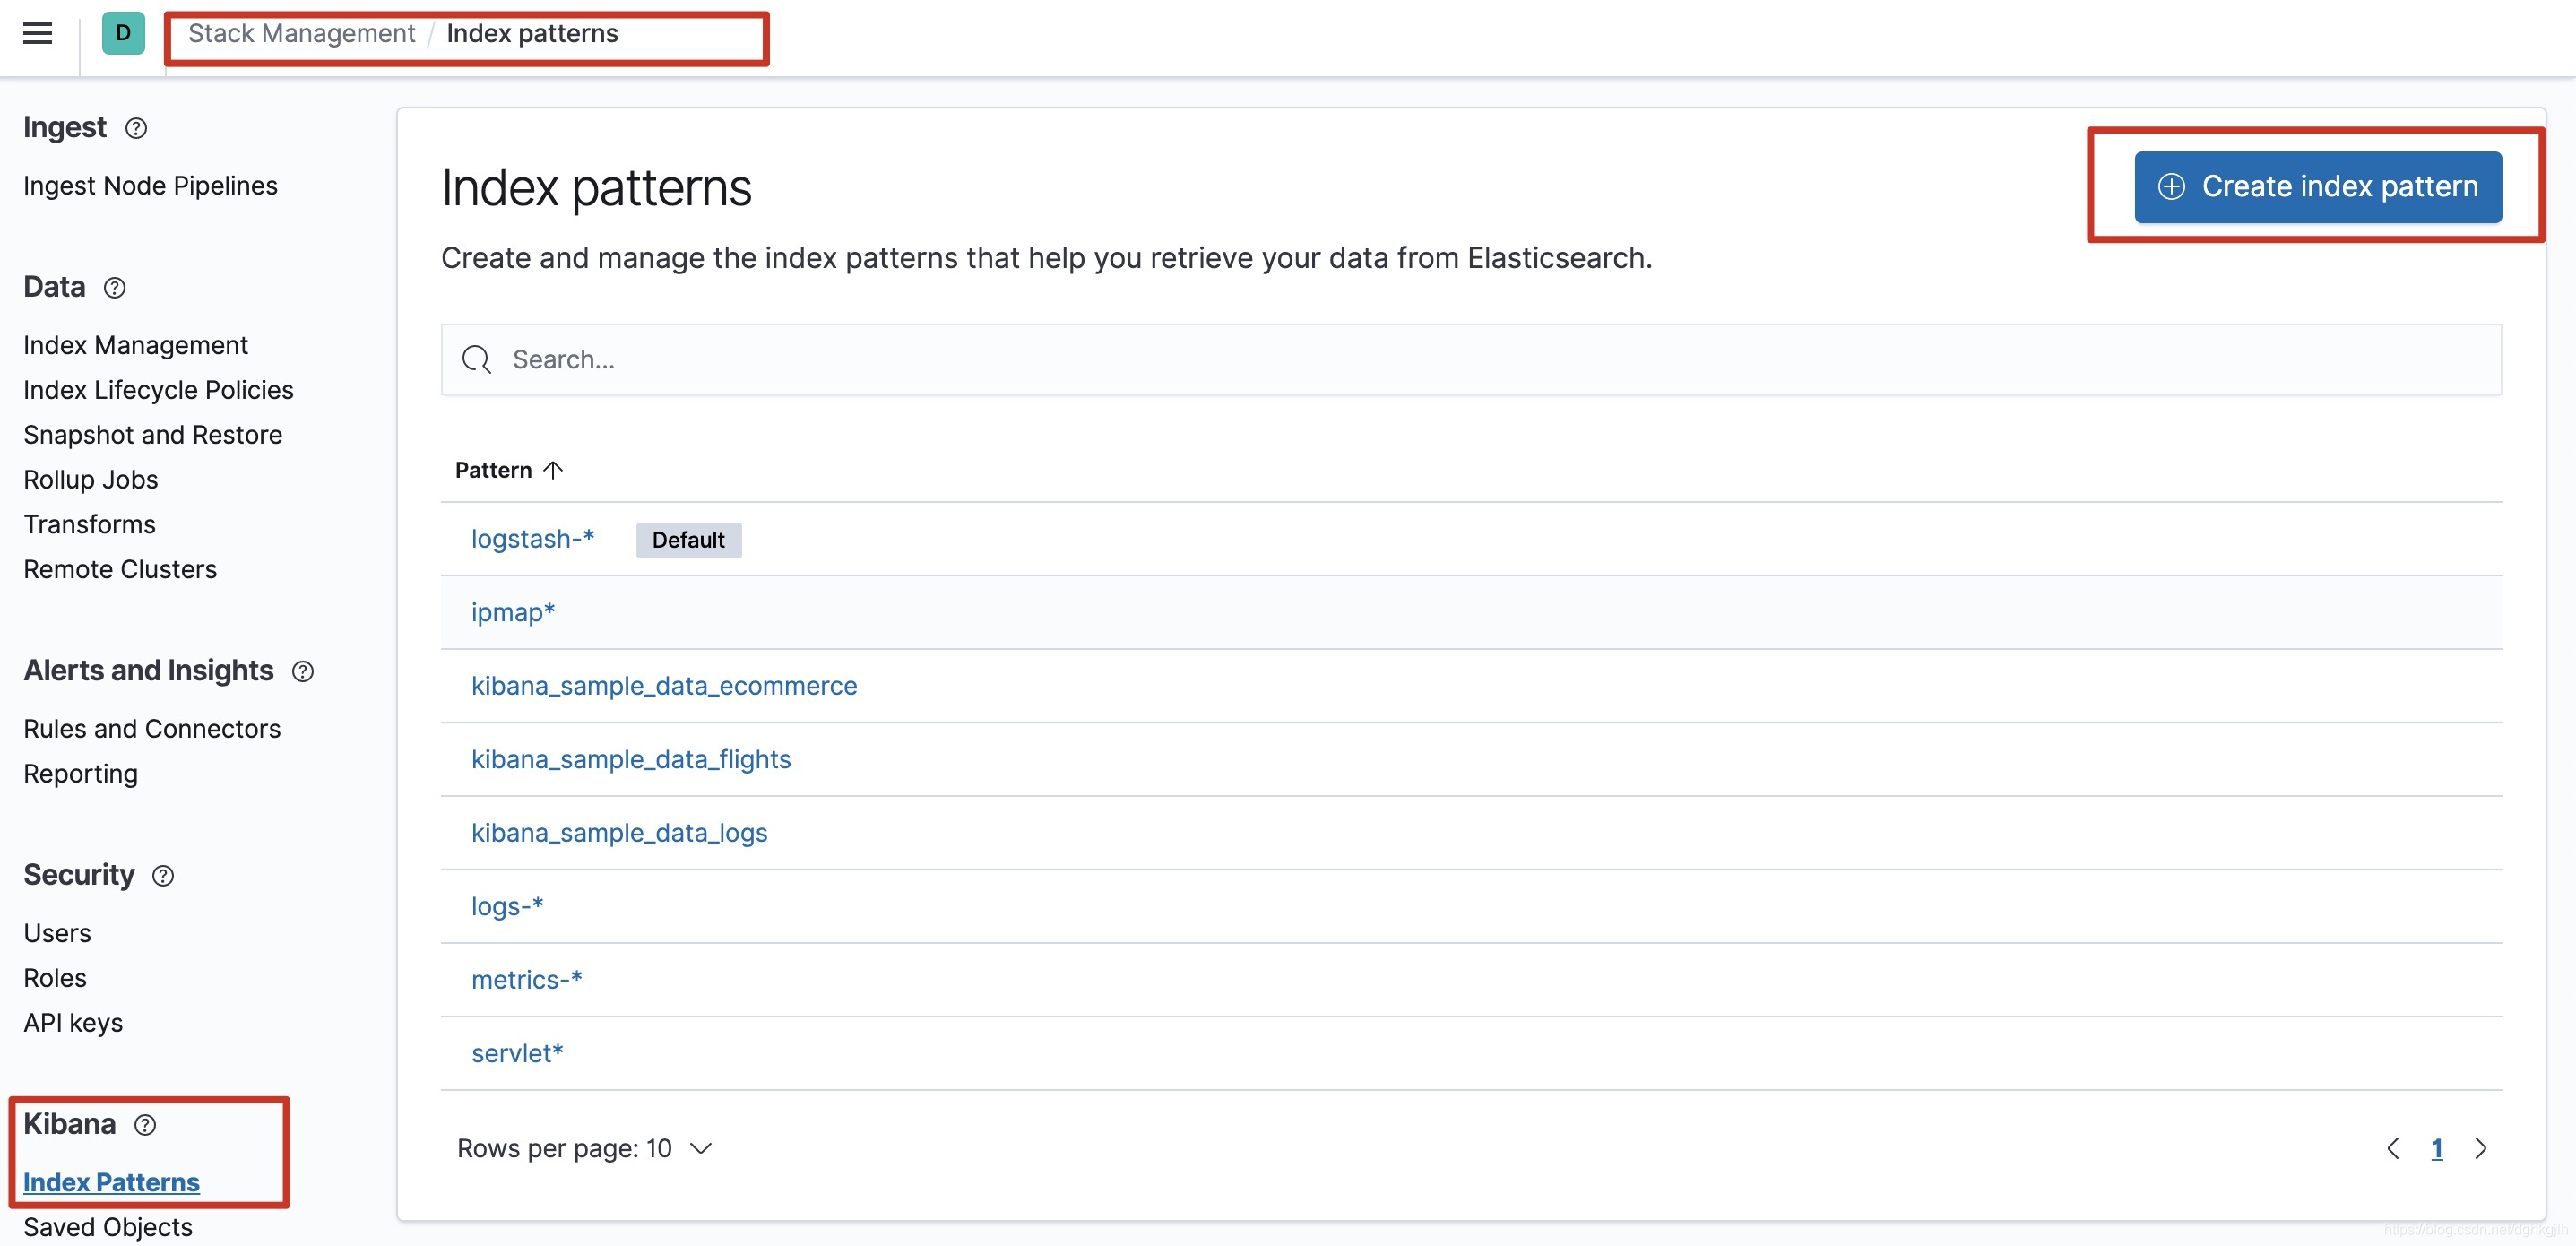
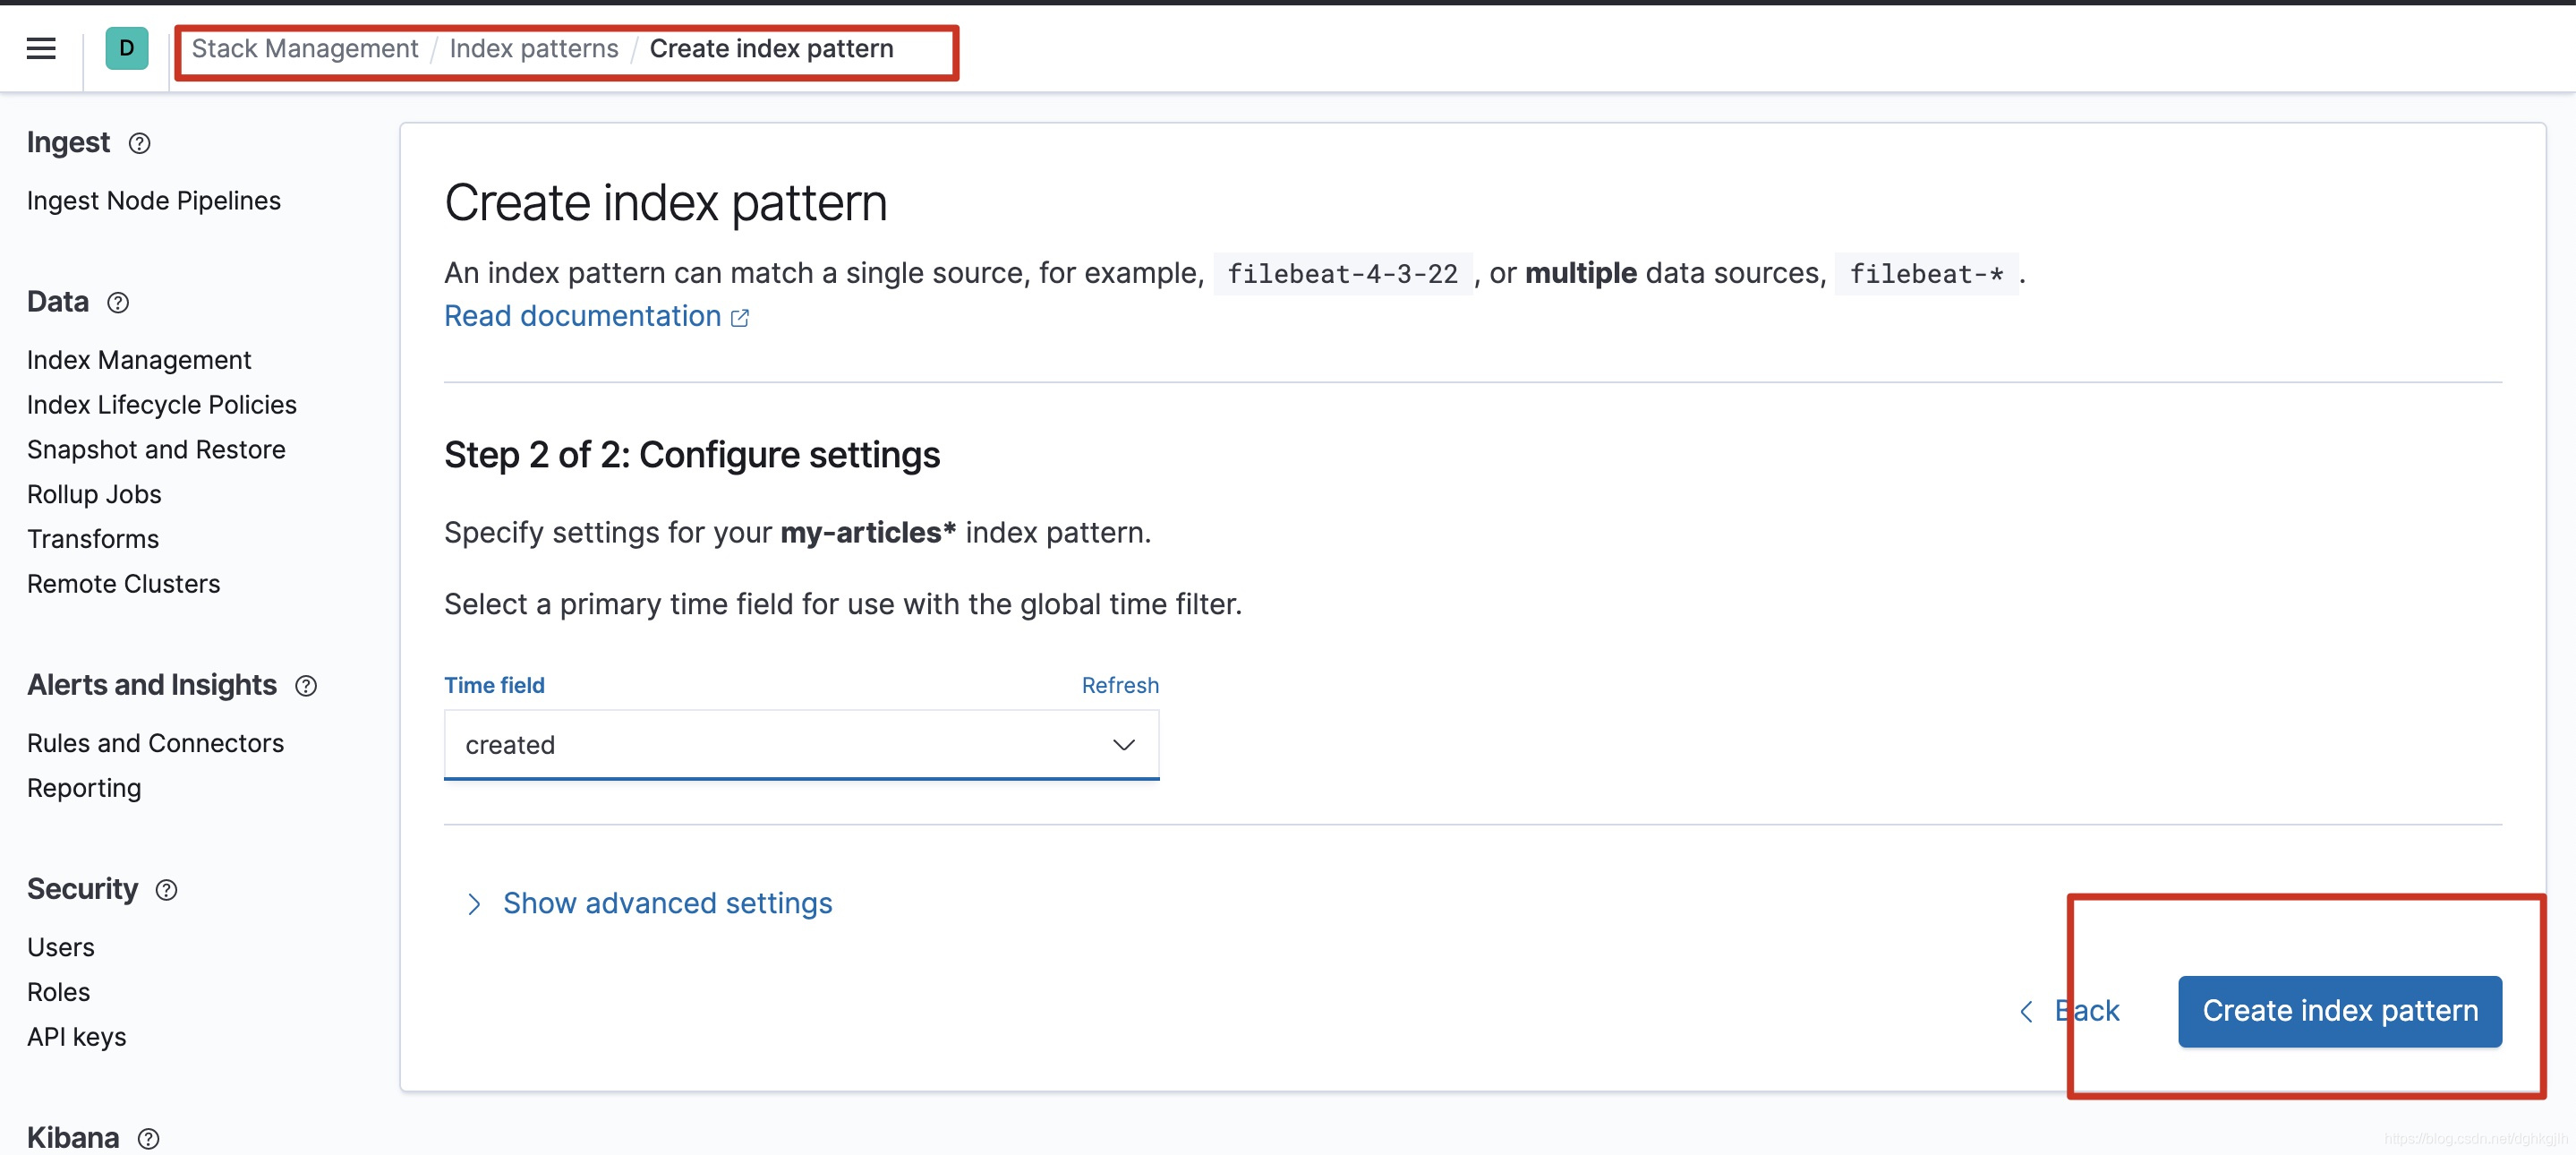
Click Create index pattern, select the index just created, and click Next step. Choose created as the time field, then click Create index pattern.
Viewing Data
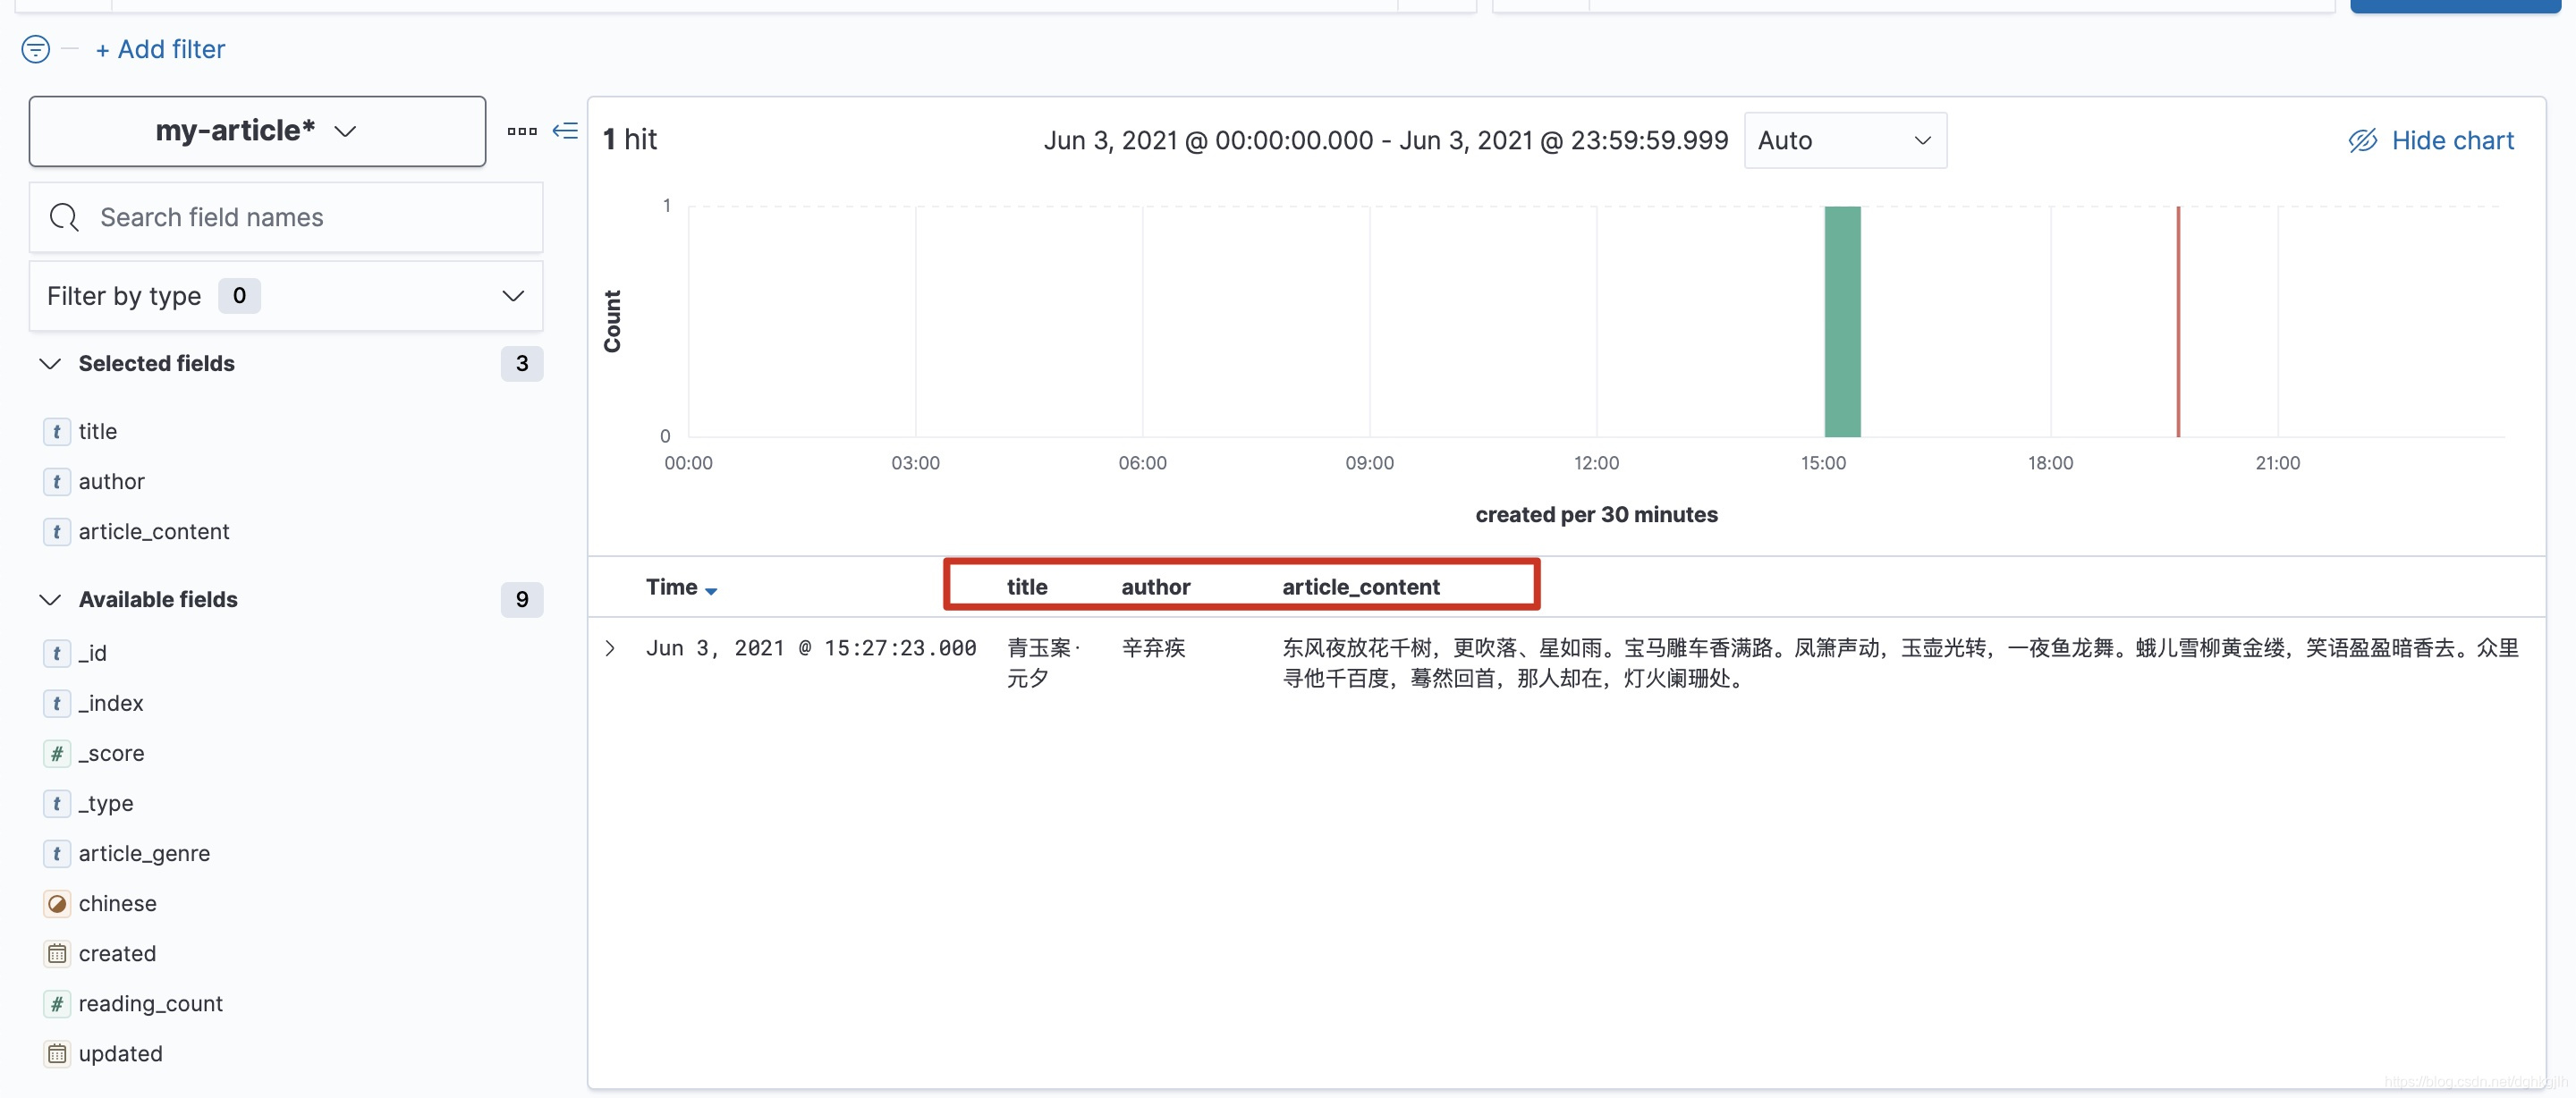
Select the index pattern and refresh. If no data appears, adjust the time range to include the data.
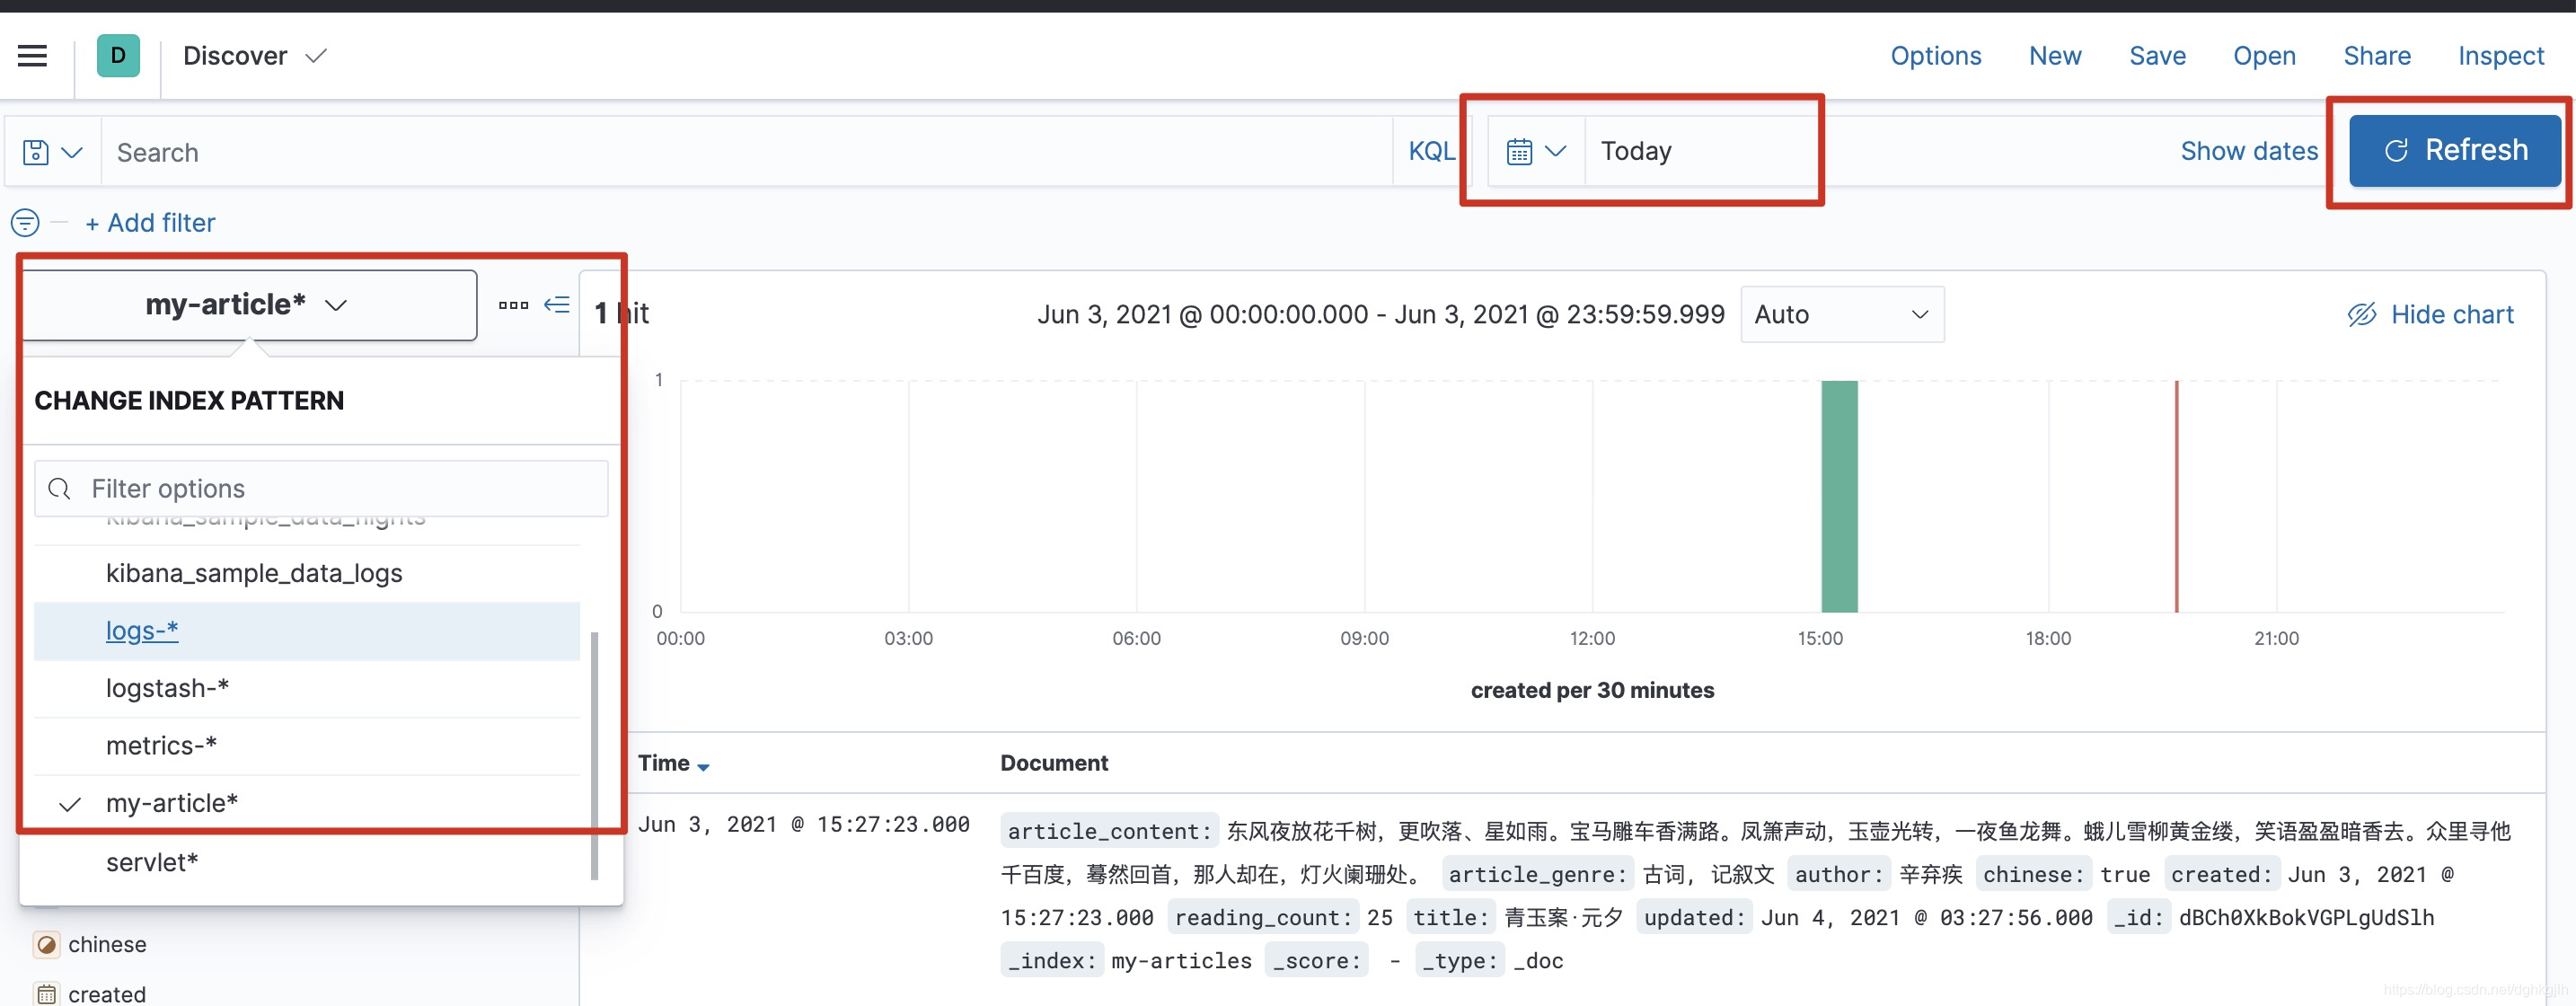
By default, only Time and Document are displayed.
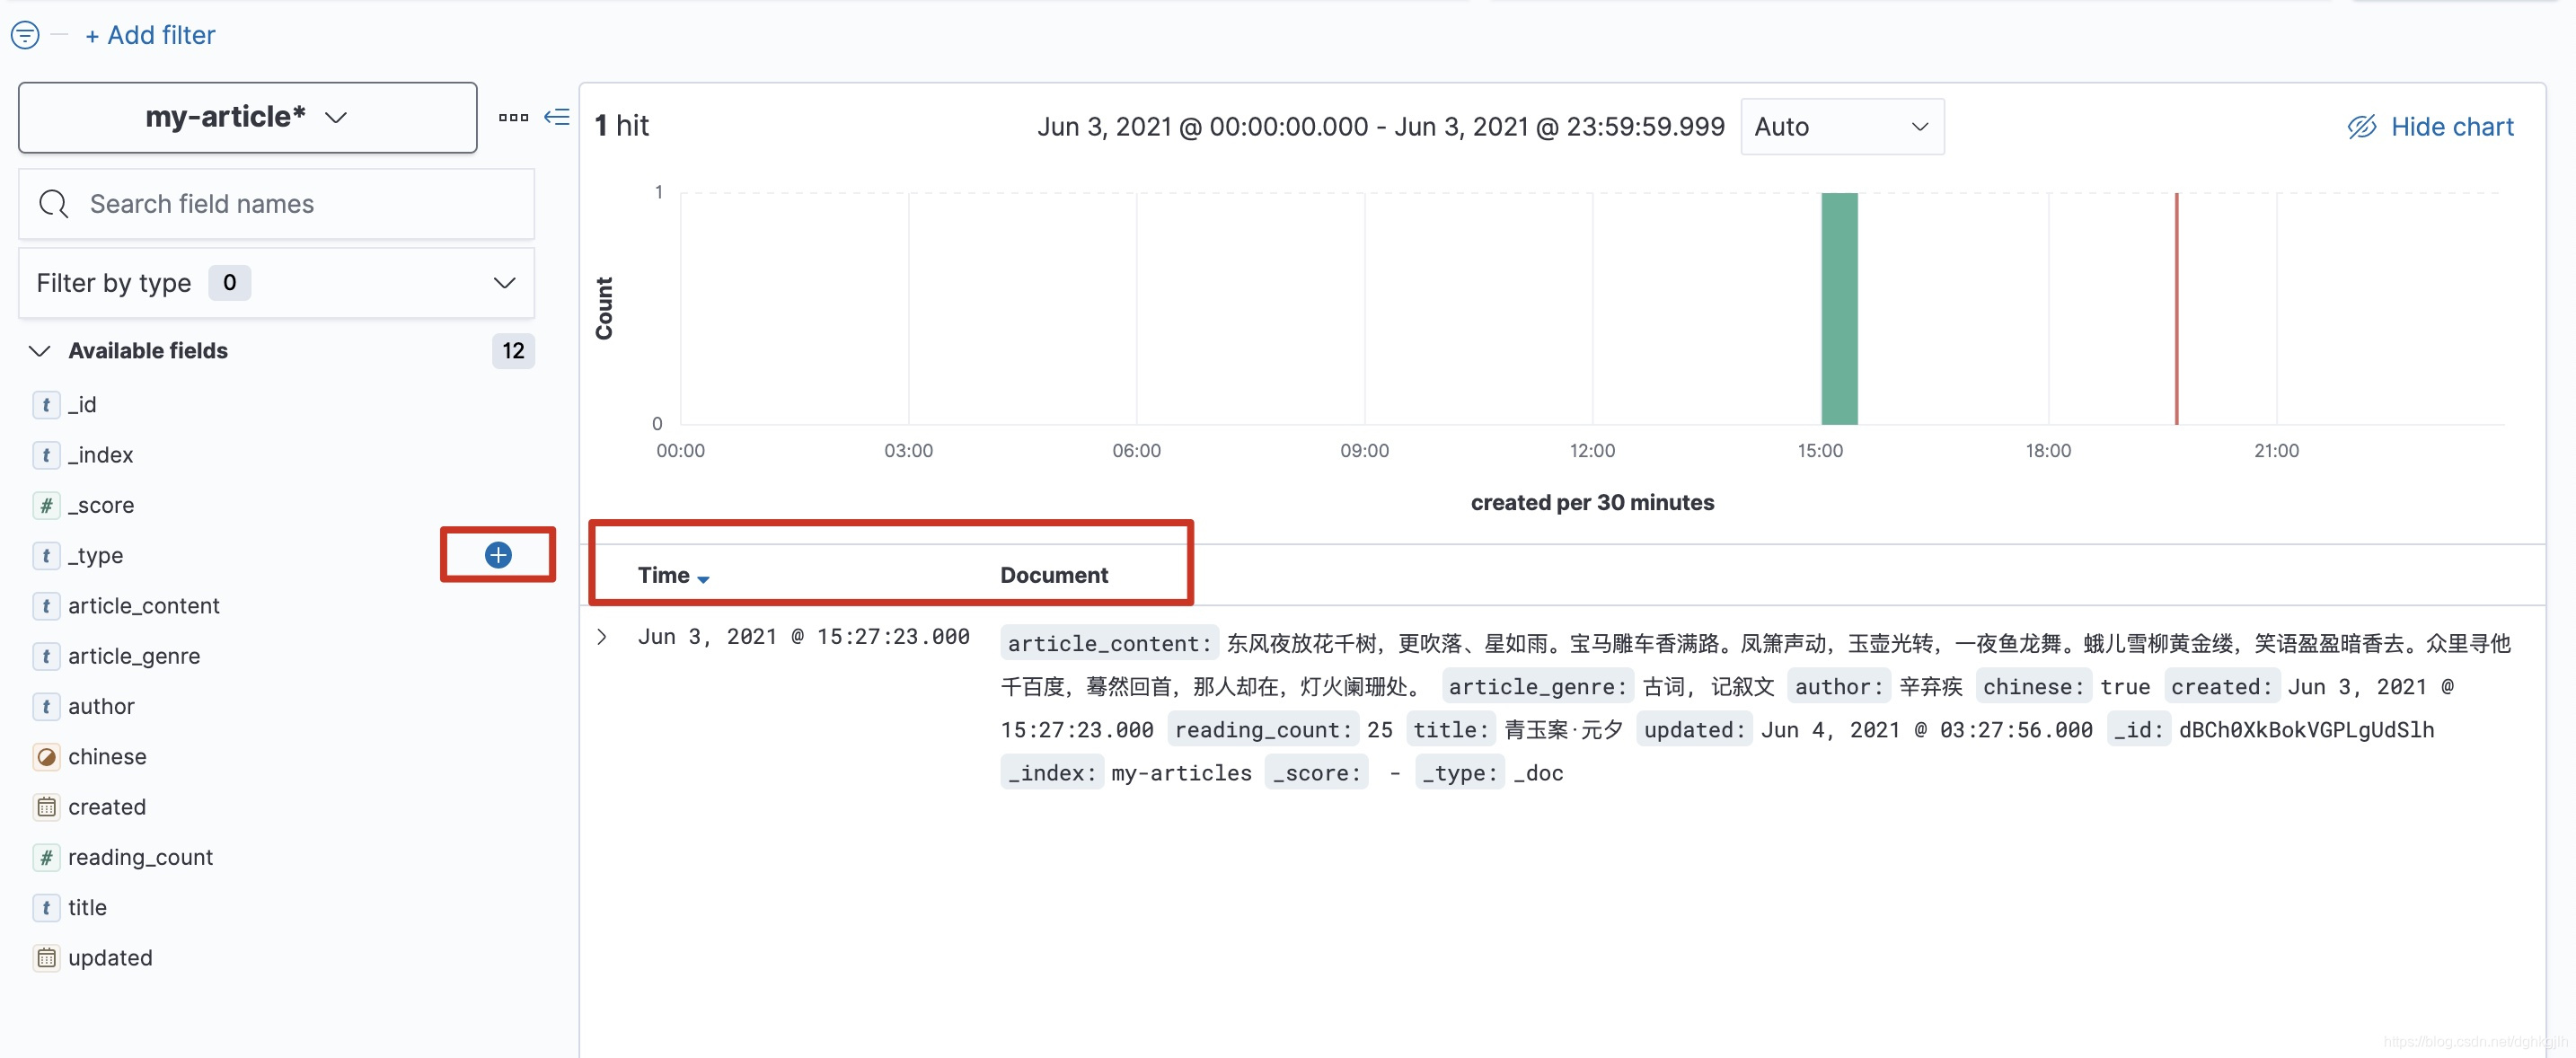
Click + on frequently viewed fields to add them as columns.
Final Notes
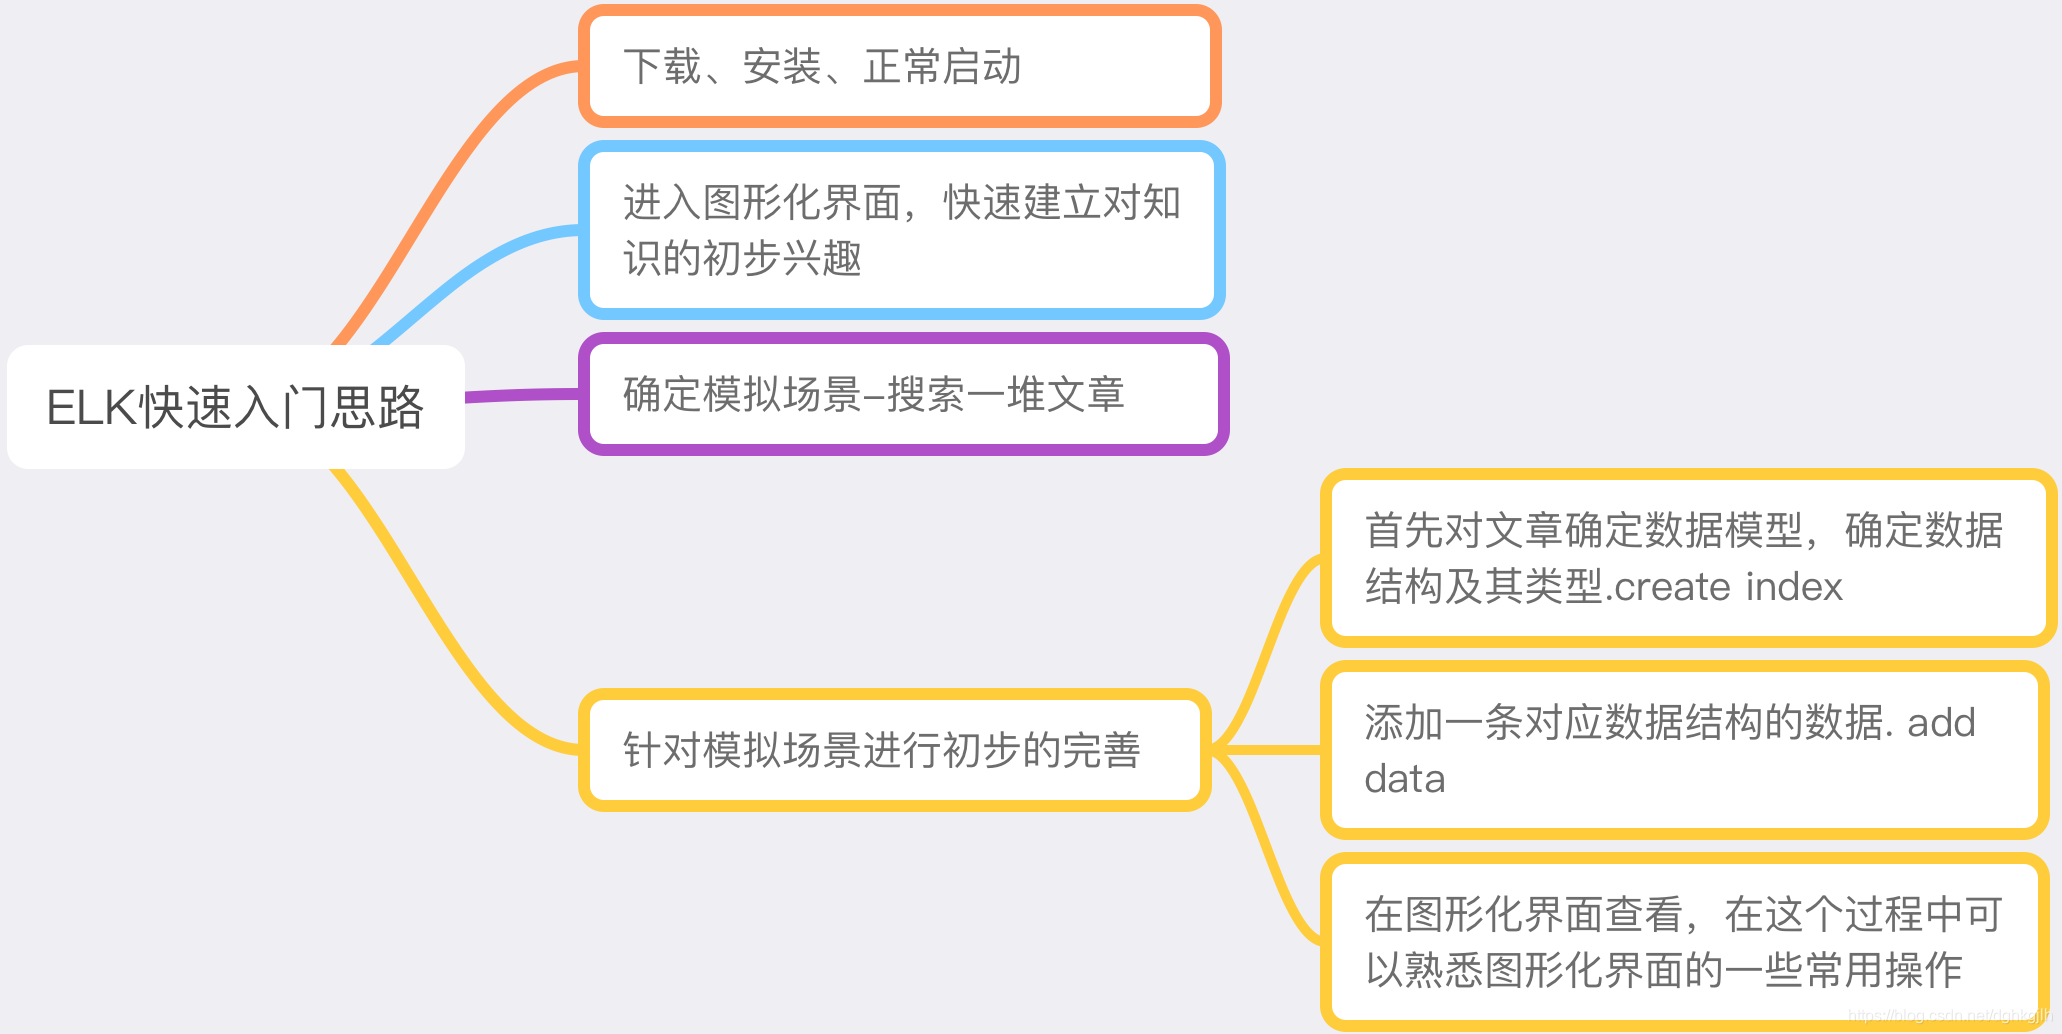
This is a basic introduction. My approach is:
- Download and verify installation first.
- Start all three components and confirm they work.
- Simulate a scenario, then read the corresponding official documentation for its needs. Here we need only to create an index and add data. Updating indexes and data is outside this initial scope. I believe getting started should quickly build interest; other questions can follow later.
Logstash is not yet needed in this scenario, so confirming installation and startup is enough. Later articles will explain it more thoroughly when we use it.
Mind Map
 The next article focuses on Elasticsearch query syntax.