Table of contents
Open Table of contents
JMX Use Cases
JMX monitors information about objects inside the JVM. A classic example: we suddenly hear that large parts of the business are down. Investigation reveals that a bug left database connections unreleased, leaving later requests with no available connections and causing timeouts.
If JMX monitors the connection pool, a rapid increase in connection usage can trigger monitoring and alerts—for example through Nagios or JMX Exporter + Prometheus + Grafana—before the problem fully develops. This can help avoid the situation above.
MXBean Versus MBean
JMX supports MBeans and MXBeans. Only MXBean examples are provided here; consult the official documentation below if interested in MBeans.
A simple one-sentence summary: an MXBean can contain objects, while an MBean can contain only primitive types and String. JConsole can display MXBean objects but not MBean objects.
For more MBean examples, inspect JMX support in open-source frameworks, such as LoggerContextAdminMBean and ContextSelectorAdminMBean in Log4j2.
Using JMX
Using JMX is simple and involves these steps.
Define an MXBean
@MXBean
public interface MyMXBean{

    User getUser();

    String getName();

    void setName(String name);

    void logMessage();

}
There are two approaches:
- Use @MXBean directly.
- Omit the annotation, but end the interface name in MXBean.
Other important points
- JConsole displays Name for getName, removing the get prefix. For getname, it displays name.
- MXBeans can display custom objects such as User here, while MBeans cannot. The MXBean User property is wrapped in CompositeDataSupport.
- Attributes shown in JConsole are defined in the MXBean implementation, while their get/set methods are defined in the MXBean interface. They are associated through implemented interface methods. A property without related interface methods is not visible in JConsole.
- Operations shown in JConsole do not concern attributes in the current class.
- Attribute names are derived by removing get*, set*, or is* prefixes. If both setter and getter exist, the value can be edited directly under Attributes and then refreshed. A simple way to tell: if the value area on the right is blue, it is generally editable, indicating both setA and getA. If gray, it is read-only, with only getA.
- Methods not following these patterns are operations. A set* method with multiple arguments can also be an operation; see org.apache.logging.log4j.core.jmx.LoggerContextAdminMBean#setConfigText.
Implement the MXBean
public class MyMXBeanImpl implements MyMXBean {

    private String name = "jack";

    private User user = User.builder().name("jack").password(888888L).used(false).build();;

    @Override
    public User getUser() {
        return user;
    }

    @Override
    public String getName() {
        return name;
    }

    @Override
    public void setName(String name) {
        this.name = name;
    }

    /**
     * Example JMX operation
     */
    @Override
    public void logMessage() {
        log.info("log message");
    }
}
Register the MXBean with JMX
@Component
public class JMXRegister {

    @PostConstruct
    @SneakyThrows
    public void registerMXBeans() {
        MBeanServer mbs = ManagementFactory.getPlatformMBeanServer();
        // See javax.management.ObjectName documentation for the full syntax
        ObjectName mxbeanName = new ObjectName("com.demo.jmx.mbean:type=MyMXBeanImpl, name=custom");
        MyMXBeanImpl myMXBean = new MyMXBeanImpl();
        mbs.registerMBean(myMXBean, mxbeanName);
    }
}
This is straightforward: instantiate the bean to monitor and give it a name. ObjectName has the form:
xxx:type=MXBean_implementation_class_name, name=custom_nameMonitor with JConsole
Start the application, launch JConsole, find the application process, and connect. The custom MXBean appears under MBeans.
You can see Attributes and Operations.
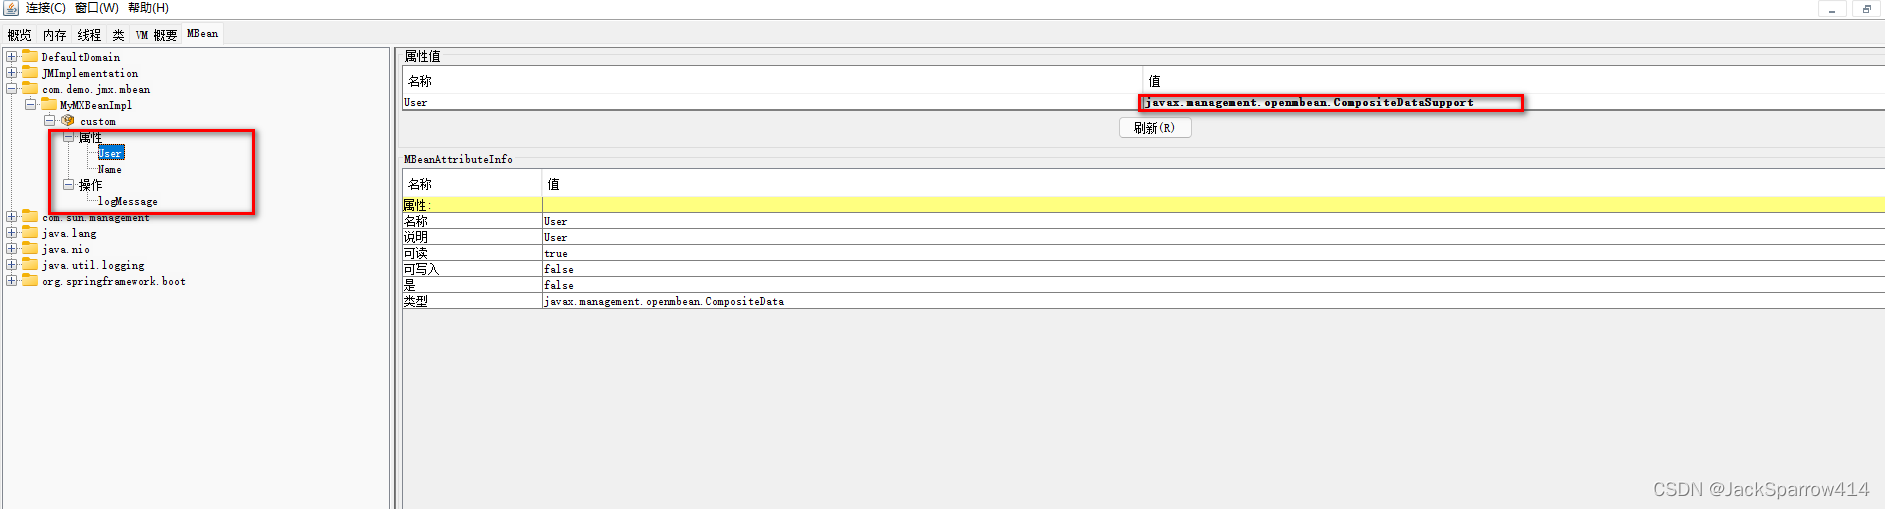 Double-click the CompositeDataSupport attribute value to show the object’s internal properties; double-click again to hide them.


 Under each attribute, you can inspect and modify its value.
Note: whether a value can be changed depends on its modifiers. A final field cannot be changed.
Here we can also see the MXBean’s ObjectName in JMX. This is useful for monitoring an MXBean in a third-party library when you do not know its name. Run the code locally and locate it in JConsole.
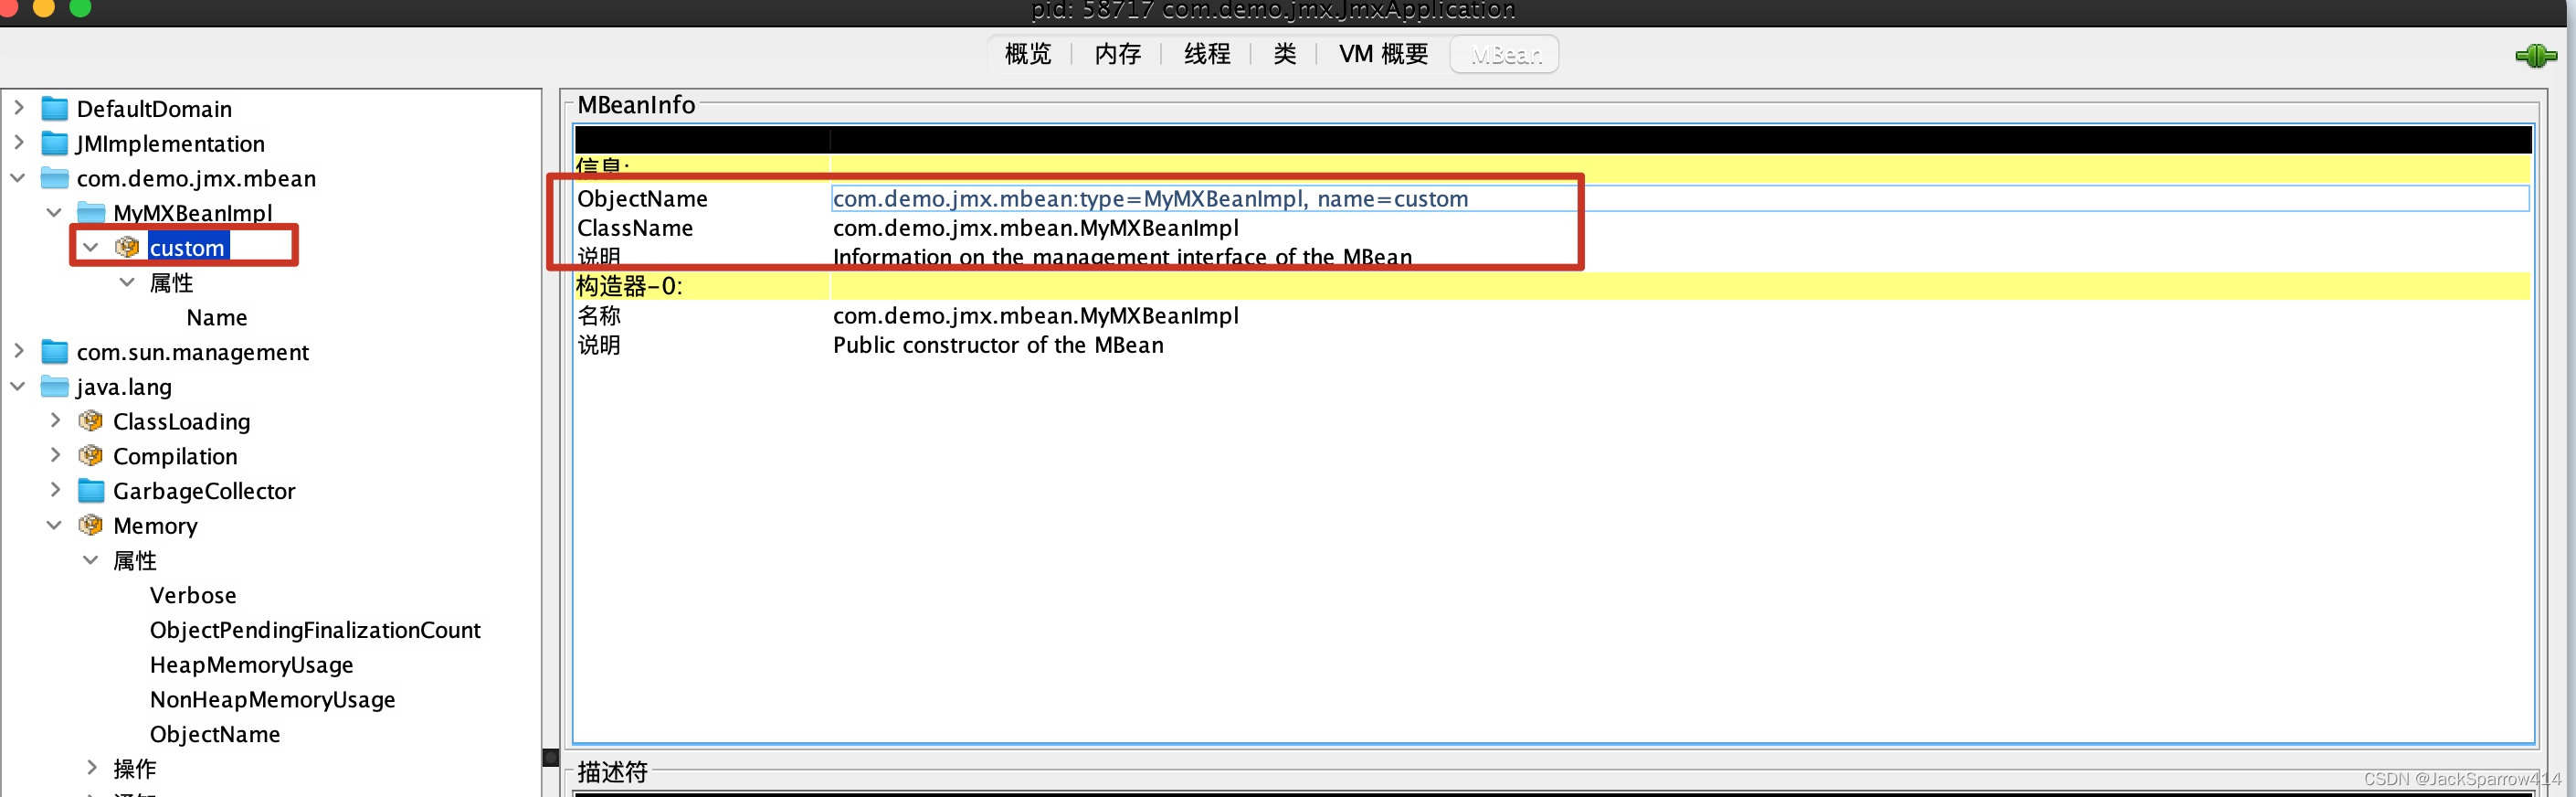
To connect to remote JMX, use a URL like this:
service:jmx:rmi://192.168.30.10:1234/jndi/rmi://192.168.30.10:2344/jmxrmiservice:jmx:rmi://<TARGET_MACHINE>:<JMX_RMI_SERVER_PORT>/jndi/rmi://<TARGET_MACHINE>:<RMI_REGISTRY_PORT>/jmxrmiThat should be clearer. If not, see this Stack Overflow explanation of JMX URLs.
Query MBeans
    /**
     * curl 'http://localhost:18081/jmx/mbean?objectName=com.demo.jmx.mbean%3Atype%3DMyMXBeanImpl%2C%20name%3Dcustom'
     * @param objectName
     * @return
     */
    @SneakyThrows
    @GetMapping
    public String queryMbeans(@RequestParam String objectName) {
        MBeanServer platformMBeanServer = ManagementFactory.getPlatformMBeanServer();
        ObjectName mxbeanName = new ObjectName(objectName);
//        Pass null to query all MBeans
//        platformMBeanServer.queryMBeans(null, null);
        MBeanAttributeInfo[] mBeanAttributeInfos = platformMBeanServer.getMBeanInfo(mxbeanName).getAttributes();
        for (MBeanAttributeInfo mBeanAttributeInfo : mBeanAttributeInfos) {
            log.info(mBeanAttributeInfo.getName());
            log.info(mBeanAttributeInfo.getClass().getName());
        }
//        Obtain AttributeList through MBeanAttributeInfo
        AttributeList attributes = platformMBeanServer.getAttributes(mxbeanName, Arrays.stream(mBeanAttributeInfos).map(MBeanFeatureInfo::getName).toArray(String[]::new));
//        Iterate over AttributeList to retrieve each attribute value
        attributes.forEach(each -> {
            if (each instanceof Attribute) {
                String value = ((Attribute) each).getValue().toString();
                log.info(value);
            }
        });

        return "ok";
    }
Follow Naming Conventions When Defining MBeans
If the MBean interface is HelloMBean, its implementation must be named Hello, removing the MBean suffix. Otherwise an exception like this occurs:
MBean class com.demo.jmx.mbean.HelloJmx does not implement DynamicMBean, and neither follows the Standard MBean conventions (javax.management.NotCompliantMBeanException: Class com.demo.jmx.mbean.HelloJmx is not a JMX compliant Standard MBean)
The official Standard MBeans documentation describes this convention.
By convention, an MBean interface takes the name of the Java class that implements it, with the suffix MBean added
JMX Monitoring
Integrate JMX Exporter with Prometheus
Many JMX monitoring solutions exist. Their underlying approach is querying MBeans as above, wrapped with configuration. JMX Exporter is popular. As OpenTelemetry develops, we have decided to transition our monitoring architecture to it gradually.
The basic architecture is:
- Tomcat uses the JMX Exporter agent to query JMX metrics and format them according to OpenMetrics.
- Install an OpenTelemetry Collector on the Tomcat server. Its Prometheus receiver periodically scrapes JMX Exporter.
- Expose the collected metrics on a port, such as 8899, through the Prometheus exporter. Metrics remain exposed for five minutes; see metric_expiration.
- The Prometheus server periodically scrapes port 8899.
Less common options include the Nagios check_jmx plugin.
Handling JMX Exporter Broken Pipe Errors and Improving Scrape Performance
These errors usually occur because collecting too many metrics takes so long that the connection closes. Configure includeObjectNames or excludeObjectNames to filter MBeans. pattern filters attributes within an MBean.
In practice, configure only the MBeans and metrics you need. Here is a simple example:
# for the metrics of the jvm itself, we don't have to declare them, they are automatically exported, see https://groups.google.com/g/prometheus-users/c/2WTZn5Vi4FE
includeObjectNames:
  - "org.apache.commons.pool2:type=GenericObjectPool,*"
  - "tomcat.jdbc:*"
  - "Catalina:type=Manager,*"
# using cache parameters to increase performance, note that this parameter only caches bean name expressions to rule computation and not cache metrics. see https://github.com/prometheus/jmx_exporter/tree/release-1.0.1/docs
rules:
  - pattern: 'org.apache.commons.pool2<type=GenericObjectPool, name=(\w+)><>(NumActive)'
    cache: true
  - pattern: 'tomcat.jdbc<name=\"\w+/\w+\", .*><>(NumActive)'
    cache: true
  - pattern: "Catalina<type=Manager,.*><>(activeSessions)"
cache: true- JMX Exporter automatically exports some JVM data, such as memory and threads; see client_java documentation and the mailing list. These objects currently cannot be filtered; see the issue.
- Configure includeObjectNames for your situation to scrape only required MBeans and improve performance. Setting cache in rules can also help.
- Filtering can also be configured in Prometheus or OpenTelemetry Collector. This is not covered in detail here; investigate it if interested.
- Monitor
jmx_scrape_duration_secondsto see when collection times out. We currently see occasional scrapes lasting tens of seconds or over 100 seconds even with very few included MBeans. We have not found the cause. The project has said JMX itself is not very efficient. Please share solutions if you have encountered this. Updated 2024-11-15: this issue is resolved. See Fixing JMX Exporter Metric Scrape Timeouts.
Integrate OpenTelemetry JMX Metric Insight
If you use or are transitioning to OpenTelemetry, you can also use its JMX Metric Insight. It is not explained in detail here; investigate it if interested. Related official blog post.
Integrate OpenTelemetry JMX Metric Gatherer
This is similar to JMX Exporter httpserver mode, though the current development status of this component is unclear.
Integrate OpenTelemetry JMX Metric Scraper
This is similar to JMX Exporter agent mode. The component is still in development. There is also a JMX Receiver, currently unmaintained.
These three approaches are based on Customizing_JMX_Metric_Collection_with_OpenTelemetry.
Official JMX Documentation
JMX Examples in Other Frameworks
JMX appears in many places. Two examples:
- SpringApplicationAdminMXBean in Spring Boot.
- MemoryMXBean inside Java.