Table of contents
Open Table of contents
- Background
- Configuration 1: Query All MBeans
- Configuration 2: An Inclusion List
- Configuration 3: Add Caching
- Configuration 4: Disable Default JVM Exports in the Source
- Configuration 5: Add excludeObjectNameAttributes to Configuration 4
- Configuration 6: Source Changes and includeObjectNameAttributes
- JMX Exporter Source Analysis
- Contributing the Changes Upstream
- Production Configuration Recommendations
Background
In Getting Started with JMX, Monitoring with JMX Exporter, and OpenTelemetry Integration, I mentioned an unresolved problem:
We currently have very few MBeans configured in includeObjectNames, yet jmx_exporter sometimes takes tens or even more than a hundred seconds to scrape metrics. We have not found the cause yet.
Our system’s scale-out and scale-in mechanism (adding or removing machines) is:
- Prometheus periodically pulls data from jmx-exporter.
- Grafana defines alert rules based on Prometheus data.
- When an alert fires, scripts call AWS service APIs to bring machines online or offline, start or stop them, and so on.
This mechanism depends heavily on jmx-exporter’s data. If intermittent exporter timeouts prevent Prometheus from collecting data, the downstream scripts are seriously affected. (Please do not ask why we implemented this ourselves instead of using Kubernetes. Well… real-world circumstances are complicated.)
The DevOps team had been unable to resolve this issue and lacked Java knowledge, so they asked me to investigate. The following is a complete record of the troubleshooting process and reasoning.
Not every server was affected, only servers running certain kinds of code. For example, servers generating reports and running scheduled report-generation tasks were particularly prone to the problem.
Configuration 1: Query All MBeans
After spending time learning the overall monitoring architecture (described in the JMX article), I examined Tomcat logs. The jmx-exporter agent exceptions were Broken pipe and Stream is closed. I suspected that timeouts closed the connection between the agent and the OpenTelemetry Collector’s prometheus-receiver, causing these exceptions.
Why would it time out? There were two possible reasons:
- Too many metrics were being collected.
- The prometheus-receiver timeout was too short.
I inspected the jmx_exporter configuration on production servers and found the DevOps configuration was very simple:
rules:
  - pattern: ".*"
It queried all MBeans. Another issue was that our code used Ehcache, with every cache registering an MBean in JMX. Many caches therefore meant many MBeans, but we did not care about these MBeans.
My first hypothesis was that the many Ehcache MBeans made querying all metrics slow.
Configuration 2: An Inclusion List
Based on that analysis, I used jmx-exporter’s includeObjectNames to specify the MBeans we cared about.
includeObjectNames:
  - "org.apache.commons.pool2:type=GenericObjectPool,*"
  - "tomcat.jdbc:*"
  - "Catalina:type=Manager,*"
In addition to these three MBeans, JVM-related MBeans are exported by jmx-exporter by default and cannot be configured here. See the source.
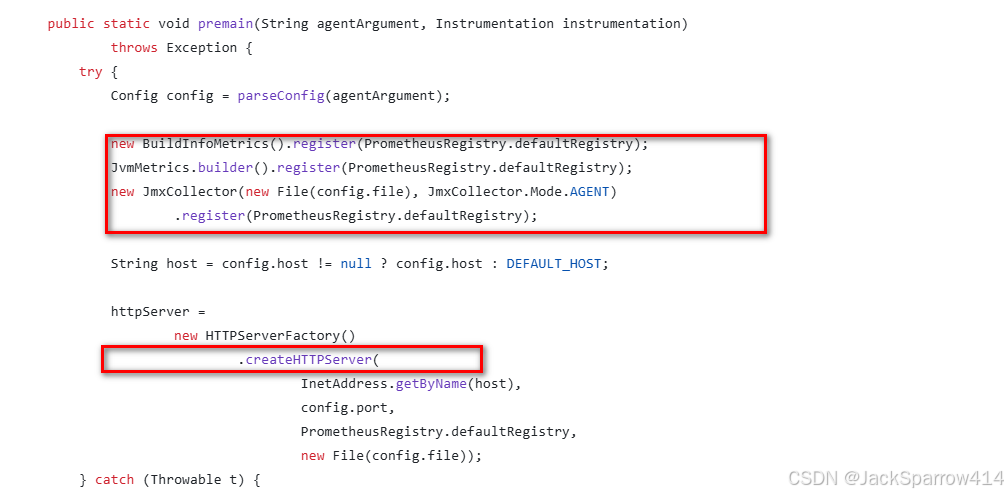
JvmMetrics.builder().register(PrometheusRegistry.defaultRegistry);
After deploying Configuration 2, the problem remained.
Configuration 3: Add Caching
I continued reading documentation, official issues, and Google results. This article about caching rules reported reduced scrape times. I changed the configuration as follows:
includeObjectNames:
  - "org.apache.commons.pool2:type=GenericObjectPool,*"
  - "tomcat.jdbc:*"
  - "Catalina:type=Manager,*"
rules:
  - pattern: 'org.apache.commons.pool2<type=GenericObjectPool, name=(\w+)><>(NumActive)'
    cache: true
  - pattern: 'tomcat.jdbc<name=\"\w+/\w+\", .*><>(NumActive)'
    cache: true
  - pattern: "Catalina<type=Manager,.*><>(activeSessions)"
    cache: true
I also increased the prometheus-receiver scrape timeout.
receivers:
  prometheus:
    config:
      scrape_configs:
        - job_name: "otel-collector"
          scrape_interval: 30s
          scrape_timeout: 29s
          static_configs:
            - targets: ["127.0.0.1:12345"]
After deploying Configuration 3, the problem remained.
Configuration 4: Disable Default JVM Exports in the Source
Since timeouts persisted, I suspected the JVM metrics themselves might be too numerous, and high JVM load could increase MBean query time. I commented out JvmMetrics.builder().register(PrometheusRegistry.defaultRegistry); in JavaAgent and changed the configuration as follows:
includeObjectNames:
  - "org.apache.commons.pool2:type=GenericObjectPool,*"
  - "tomcat.jdbc:*"
  - "Catalina:type=Manager,*"
  - "java.lang:type=Memory"
  - "java.lang:type=Threading"
rules:
  - pattern: 'org.apache.commons.pool2<type=GenericObjectPool, name=(\w+)><>(NumActive)'
    cache: true
  - pattern: 'tomcat.jdbc<name=\"\w+/\w+\", .*><>(NumActive)'
    cache: true
  - pattern: "Catalina<type=Manager,.*><>(activeSessions)"
    cache: true
  - pattern: "java.lang<type=Memory><HeapMemoryUsage>(used|max)"
    cache: true
    name: jvm_memory_$1_bytes
    type: GAUGE
    help: $1 (bytes) of a given JVM memory area
    labels: { "area": "heap" }
  - pattern: "java.lang<type=Threading><>ThreadCount"
    cache: true
    type: GAUGE
    help: Current thread count of a JVM
    name: jvm_threads_current
The name settings preserve compatibility with the JVM metric names originally exported by the source.
After deploying Configuration 4, the problem remained.
Configuration 5: Add excludeObjectNameAttributes to Configuration 4
I had still not studied jmx-exporter’s source deeply. In the documentation, I found excludeObjectNameAttributes and configured attributes we did not care about. I did not exclude every unwanted attribute from every MBean in this version: I only configured JVM-related MBeans and part of the other MBeans to test my hypothesis. I wanted to see whether a particular attribute of a JVM MBean was causing slow queries. The configuration became:
# for the metrics of the jvm itself, we don't have to declare them, they are automatically exported, see https://groups.google.com/g/prometheus-users/c/2WTZn5Vi4FE
includeObjectNames:
  - "java.lang:type=Memory"
  - "java.lang:type=Threading"
  - "org.apache.commons.pool2:type=GenericObjectPool,*"
  - "tomcat.jdbc:*"
  - "Catalina:type=Manager,*"
excludeObjectNameAttributes:
  "java.lang:type=Memory":
    - "ObjectPendingFinalizationCount"
    - "NonHeapMemoryUsage"
    - "Verbose"
    - "ObjectName"
  "java.lang:type=Threading":
    - "ThreadAllocatedMemorySupported"
    - "ThreadAllocatedMemoryEnabled"
    - "CurrentThreadAllocatedBytes"
    - "ThreadContentionMonitoringEnabled"
    - "ThreadContentionMonitoringSupported"
    - "CurrentThreadCpuTimeSupported"
    - "ObjectMonitorUsageSupported"
    - "SynchronizerUsageSupported"
    - "ThreadCpuTimeEnabled"
    - "TotalStartedThreadCount"
    - "AllThreadIds"
    - "CurrentThreadCpuTime"
    - "CurrentThreadUserTime"
    - "ThreadCpuTimeSupported"
    - "PeakThreadCount"
    - "DaemonThreadCount"
    - "ObjectName"
# using cache parameters to increase performance, note that this parameter only caches bean name expressions to rule computation and not cache metrics. see https://github.com/prometheus/jmx_exporter/tree/release-1.0.1/docs
rules:
  - pattern: "java.lang<type=Memory><HeapMemoryUsage>(used|max)"
    cache: true
    name: jvm_memory_$1_bytes
    type: GAUGE
    help: $1 (bytes) of a given JVM memory area
    labels: { "area": "heap" }
  - pattern: "java.lang<type=Threading><>ThreadCount"
    cache: true
    type: GAUGE
    help: Current thread count of a JVM
    name: jvm_threads_current
  - pattern: 'org.apache.commons.pool2<type=GenericObjectPool, name=(\w+)><>(NumActive)'
    cache: true
  - pattern: 'tomcat.jdbc<name=\"\w+/\w+\", .*><>(NumActive)'
    cache: true
  - pattern: "Catalina<type=Manager,.*><>(activeSessions)"
    cache: true
After deploying Configuration 5, the problem remained, although jmx_scrape_duration_seconds decreased while timeout frequency increased.
This version tested two hypotheses:
- Queries of JVM MBeans themselves were not causing the timeout.
- Excluding unnecessary MBean attributes could reduce
jmx_scrape_duration_seconds.
The key question remained: which attribute of which MBean caused it? The scope was now narrowed to three MBeans.
Configuration 6: Source Changes and includeObjectNameAttributes
Why not keep adding excludeObjectNameAttributes now that only three MBeans remained? I found that configuration too cumbersome. If I later wanted to monitor one attribute of an MBean with hundreds of attributes, adding all those exclusion rules would be exhausting. I therefore decided to modify the source so jmx-exporter queries only attributes I explicitly declare. After examining the source, I made these changes:
Source Changes Based on release-1.0.1
- Change
io.prometheus.jmx.ObjectNameAttributeFilteras follows:
public static final String INCLUDE_OBJECT_NAME_ATTRIBUTES = "includeObjectNameAttributes";
private final Map<ObjectName, Set<String>> includeObjectNameAttributesMap;

private ObjectNameAttributeFilter() {
        excludeObjectNameAttributesMap = new ConcurrentHashMap<>();
        includeObjectNameAttributesMap = new ConcurrentHashMap<>();
    }
Add the following to io.prometheus.jmx.ObjectNameAttributeFilter#initialize:
if (yamlConfig.containsKey(INCLUDE_OBJECT_NAME_ATTRIBUTES)) {
      Map<Object, Object> objectNameAttributeMap =
              (Map<Object, Object>) yamlConfig.get(INCLUDE_OBJECT_NAME_ATTRIBUTES);

      for (Map.Entry<Object, Object> entry : objectNameAttributeMap.entrySet()) {
          ObjectName objectName = new ObjectName((String) entry.getKey());

          List<String> attributeNames = (List<String>) entry.getValue();

          Set<String> attributeNameSet =
                  includeObjectNameAttributesMap.computeIfAbsent(
                          objectName, o -> Collections.synchronizedSet(new HashSet<>()));

          attributeNameSet.addAll(attributeNames);
          for (String attribueName : attributeNames) {
              attributeNameSet.add(attribueName);
          }

          includeObjectNameAttributesMap.put(objectName, attributeNameSet);
 }
Also add:
public boolean include(ObjectName objectName, String attributeName) {
     boolean result = false;

     if (includeObjectNameAttributesMap.size() > 0) {
         Set<String> attributeNameSet = includeObjectNameAttributesMap.get(objectName);
         if (attributeNameSet != null) {
             result = attributeNameSet.contains(attributeName);
         }
     }

     return result;
}- Add one line to
io.prometheus.jmx.JmxScraper#scrapeBean:
if (objectNameAttributeFilter.include(mBeanName, mBeanAttributeInfo.getName())) {
      name2MBeanAttributeInfo.put(mBeanAttributeInfo.getName(), mBeanAttributeInfo);
 }
Updated Configuration
includeObjectNames:
  - "java.lang:type=Memory"
  - "java.lang:type=Threading"
  - "org.apache.commons.pool2:type=GenericObjectPool,*"
  - "tomcat.jdbc:*"
  - "Catalina:type=Manager,*"
includeObjectNameAttributes:
  "Catalina:type=Manager,host=localhost,context=/REPLACE_WITH_ACTUAL_VALUE":
    - "activeSessions"
  "java.lang:type=Memory":
    - "HeapMemoryUsage"
  "java.lang:type=Threading":
    - "ThreadCount"
  "org.apache.commons.pool2:type=GenericObjectPool,name=REPLACE_WITH_ACTUAL_VALUE":
    - "NumActive"
  'tomcat.jdbc:name="jdbc/REPLACE_WITH_ACTUAL_VALUE",type=ConnectionPool,class=org.apache.tomcat.jdbc.pool.DataSource':
# using cache parameters to increase performance, note that this parameter only caches bean name expressions to rule computation and not cache metrics. see https://github.com/prometheus/jmx_exporter/tree/release-1.0.1/docs
rules:
  - pattern: "java.lang<type=Memory><HeapMemoryUsage>(used|max)"
    cache: true
    name: jvm_memory_$1_bytes
    type: GAUGE
    help: $1 (bytes) of a given JVM memory area
    labels: { "area": "heap" }
  - pattern: "java.lang<type=Threading><>ThreadCount"
    cache: true
    type: GAUGE
    help: Current thread count of a JVM
    name: jvm_threads_current
  - pattern: 'org.apache.commons.pool2<type=GenericObjectPool, name=(\w+)><>(NumActive)'
    cache: true
  - pattern: 'tomcat.jdbc<name=\"\w+/\w+\", .*><>(NumActive)'
    cache: true
  - pattern: "Catalina<type=Manager,.*><>(activeSessions)"
    cache: true
Verifying the Configuration
After using the new JAR and configuration, enable debug logs as recommended by the documentation. In IntelliJ IDEA > top right > Edit Configuration > Tomcat Server > VM options, add -Djmx.prometheus.exporter.developer.debug=true.
During local tests, jmx_exporter’s debug logs confirmed that it scraped only the metrics we configured.
After applying the new JAR and configuration to production, scraping just a few attributes took only 0.000xxx seconds. This was the speed and behavior we wanted.
The problem was finally solved.
JMX Exporter Source Analysis
During the source changes and investigation, I read through jmx-exporter’s code. Its key flow is:
-
Use maven-shade-plugin to configure the agent entry point.
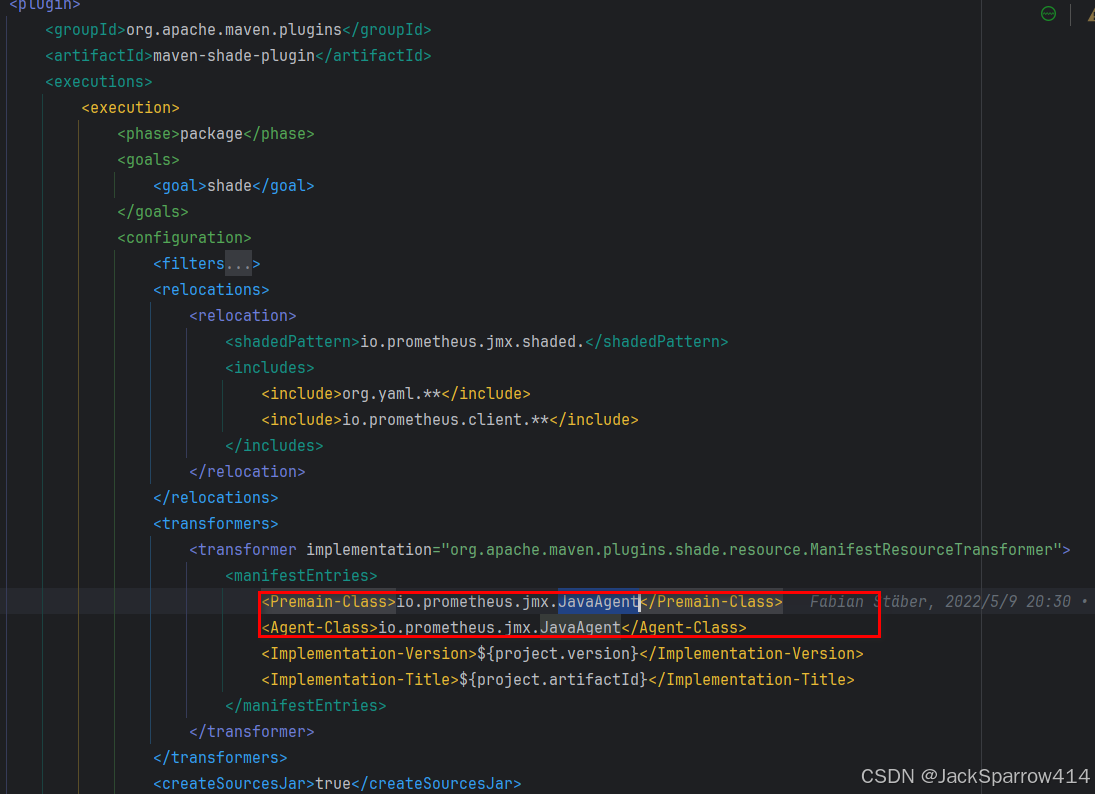 The agent entry-point class must contain premain. If interested in writing a Java agent, search for further information; I will not expand on it here.
 -
The JavaAgent entry point mainly registers the metrics to scrape in PrometheusRegistry.defaultRegistry, then starts the server.
-
The lowest-level createHTTPServer method is
io.prometheus.metrics.exporter.httpserver.HTTPServer#HTTPServer. The core is MetricsHandler.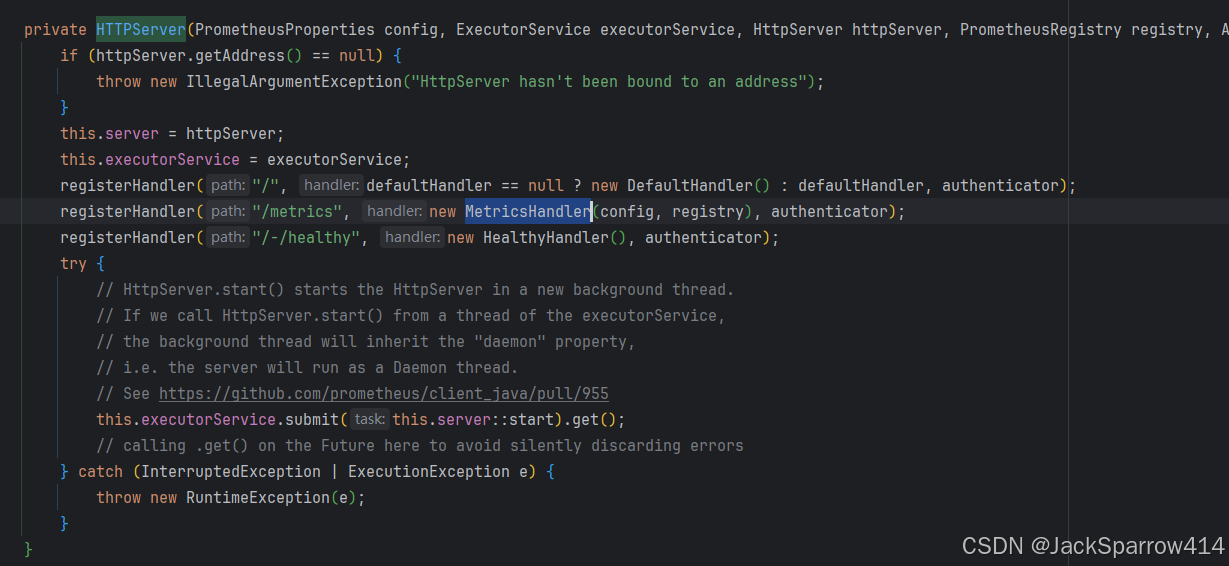
-
io.prometheus.metrics.exporter.common.PrometheusScrapeHandler#handleRequesthandles the actual request.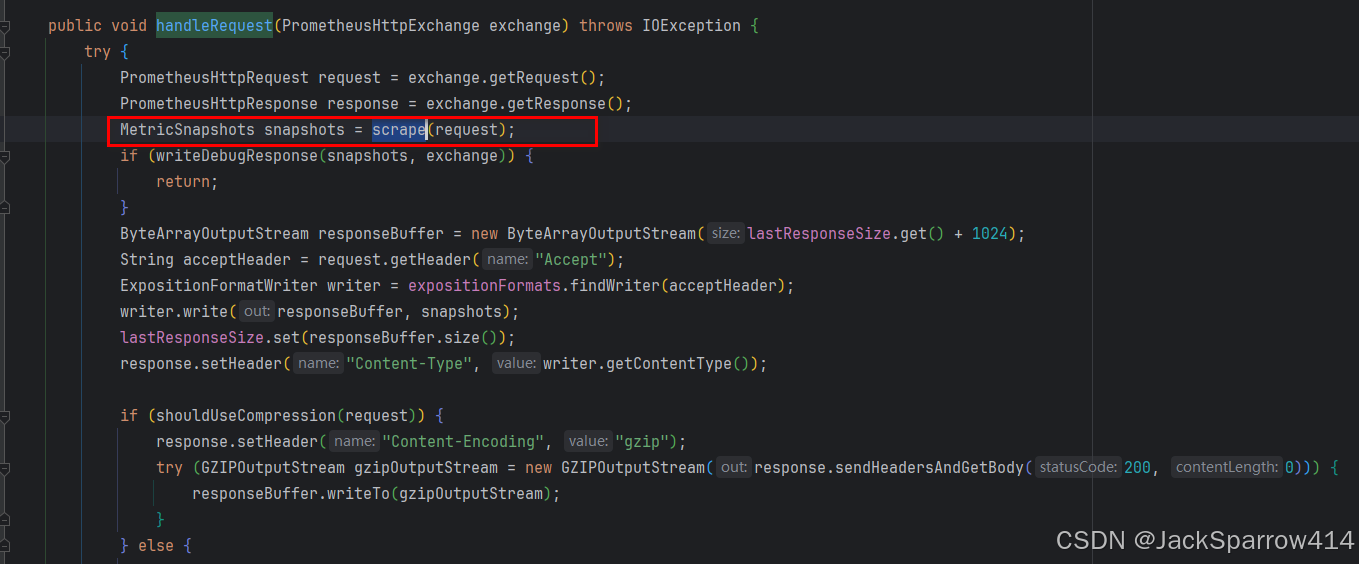
-
The underlying scrape method:
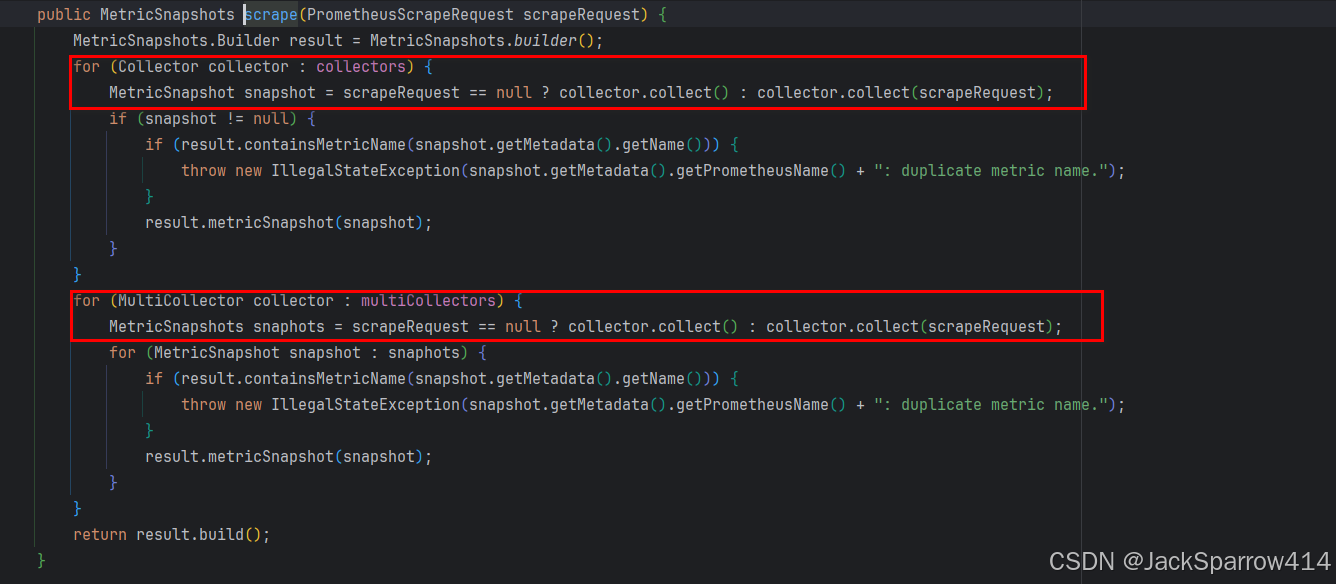 This performs the actual MBean queries. Collector implementations query JVM MBeans, for example JvmMetrics >
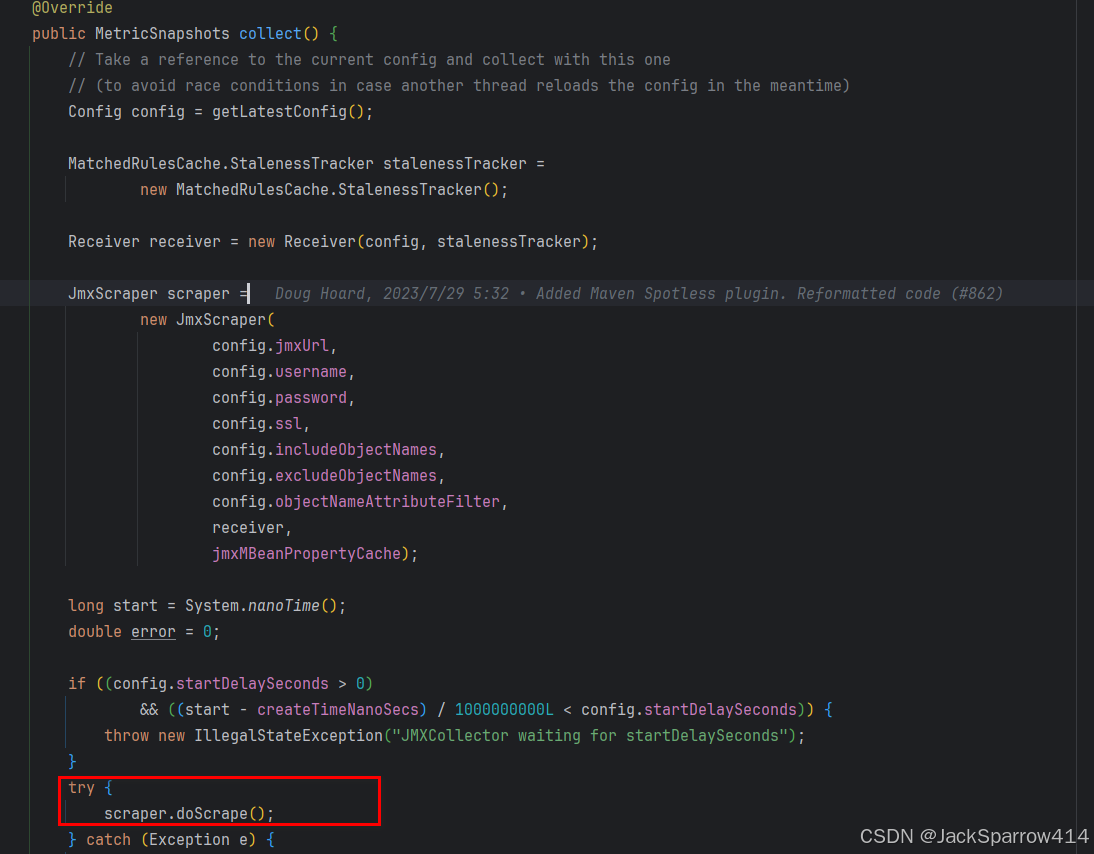
 JvmThreadsMetrics. These implementations callio.prometheus.metrics.model.registry.PrometheusRegistry#register(io.prometheus.metrics.model.registry.Collector)to add themselves to collectors. The MultiCollector implementation is JmxCollector, which queries other MBeans. For Registry, see the Prometheus Java client documentation. -
Focus on MultiCollector’s collect method.
-
The final underlying doScrape method:
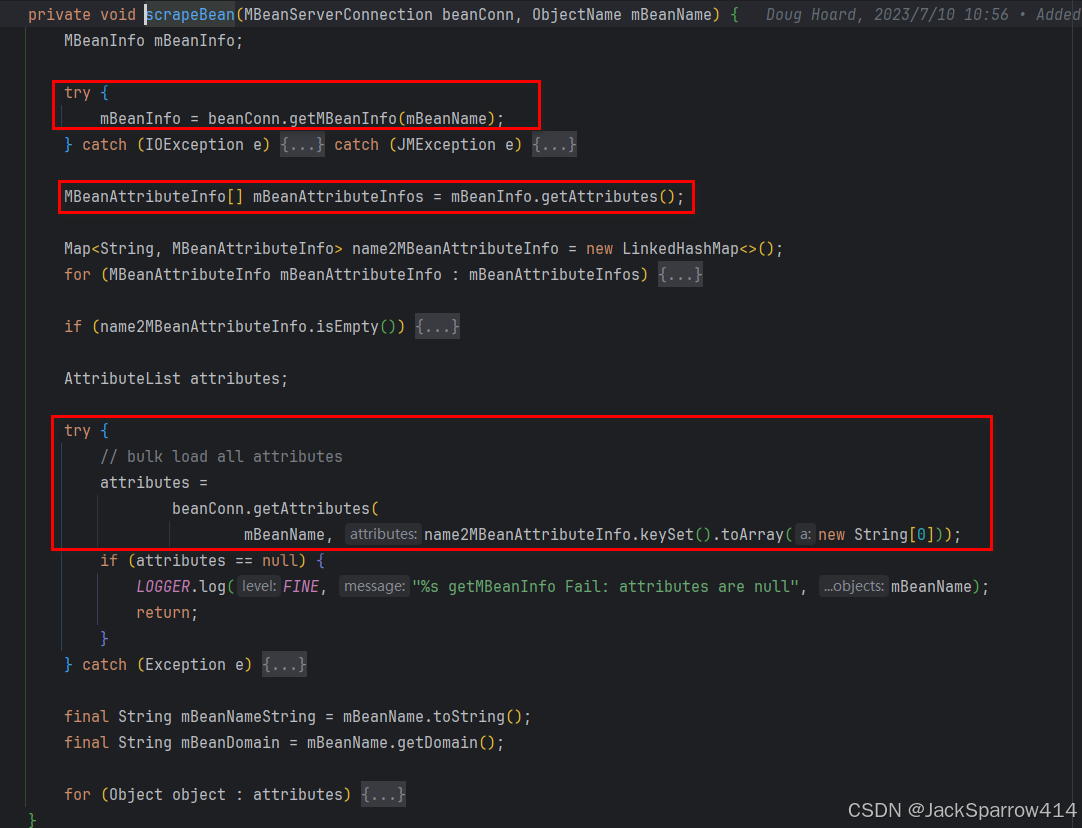 This is the key point. These steps query MBeans in the way described in Getting Started with JMX. The collapsed code afterward formats the retrieved attributes in Prometheus format. Read the source if you are interested.
That is the complete request-processing flow of the jmx-exporter agent. Feel free to explore its source.
Contributing the Changes Upstream
After solving the problem, I thought the new configuration could help in other scenarios, so I decided to contribute includeObjectNameAttributes to the community.
The PR has now been merged into main.
Production Configuration Recommendations
If you do not encounter this problem in production, I recommend Configuration 3. If you do encounter the same issue, use the final configuration and ensure your jmx-exporter release includes my PR.