Table of contents
Open Table of contents
Article body
Having used VS Code relatively little, I lacked experience developing C programs in it. This post records the steps for setting up a C development environment in VS Code.
Official Documentation
The following two documents cover the essentials. Read them carefully together.
Install the Extension
Search for C/C++ under Extensions on the left and install it.
Generate c_cpp_properties.json
- Press Command + Shift + P, then choose C/C++: Edit Configuration (UI). On macOS, the defaults generally work.
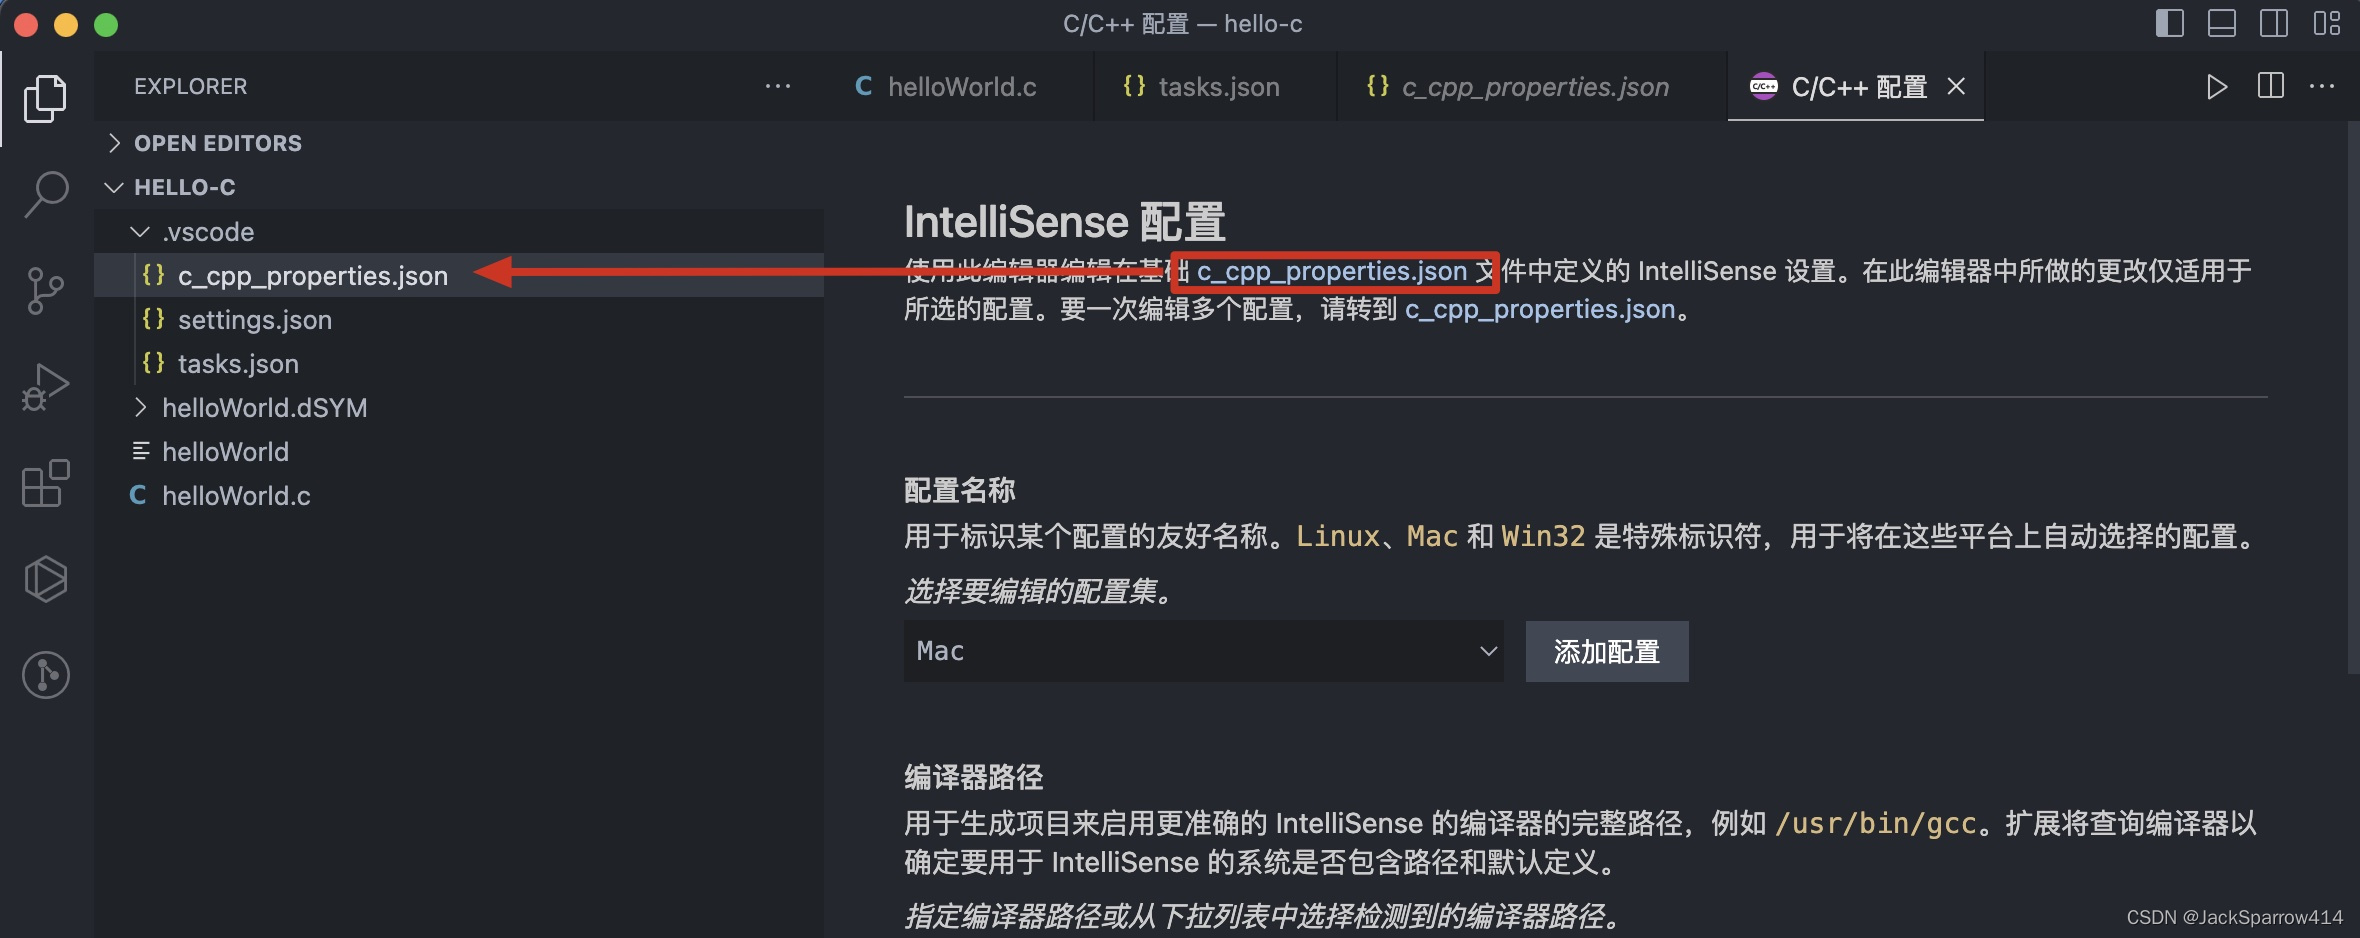 Click c_cpp_properties.json on the configuration page. A .vscode directory is created in the current folder, containing c_cpp_properties.json.
{
  "configurations": [
    {
      "name": "Mac",
      "includePath": ["${workspaceFolder}/**"],
      "defines": [],
      "macFrameworkPath": [
        "/Library/Developer/CommandLineTools/SDKs/MacOSX.sdk/System/Library/Frameworks"
      ],
      "compilerPath": "/usr/bin/clang",
      "cStandard": "c17",
      "cppStandard": "c++17",
      "intelliSenseMode": "macos-clang-x64"
    }
  ],
  "version": 4
}
Generate tasks.json
tasks.json configures compilation and builds. For more about tasks, see the official documentation.
- In a C source file, click Run C/C++ File on the right and choose C/C++: clang.
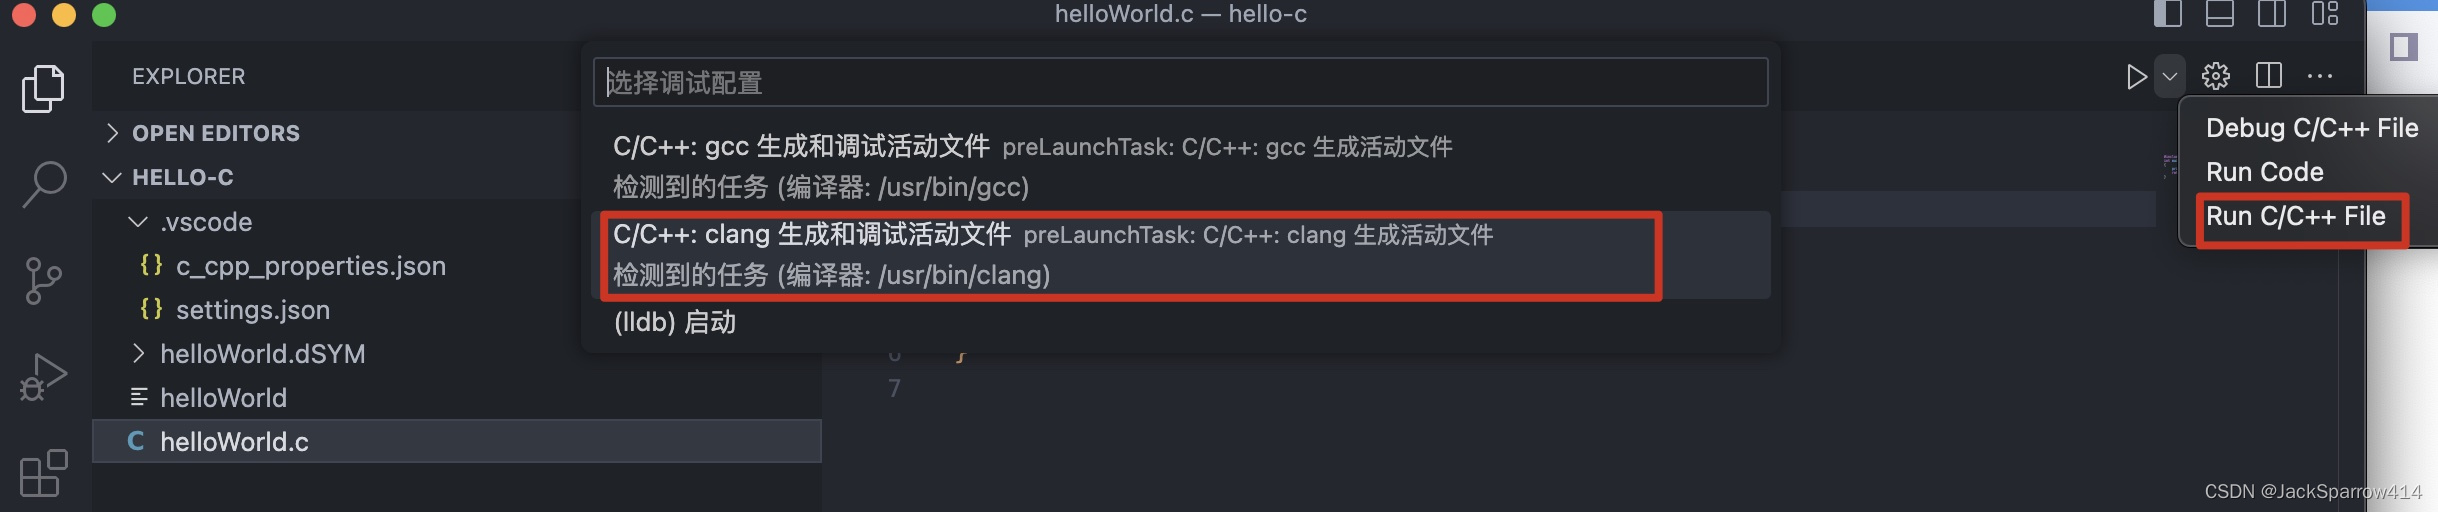 A task.json file is then created under .vscode. Official explanation
Example file:
A task.json file is then created under .vscode. Official explanation
Example file:
{
  "tasks": [
    {
      "type": "cppbuild",
      // Corresponds to preLaunchTask in launch.json. The generated label contains Chinese by default; I changed it to English.
      "label": "C/C++: clang++ build active file",
      "command": "/usr/bin/clang",
      "args": [
        "-fcolor-diagnostics",
        "-fansi-escape-codes",
        "-g",
        "${file}",
        "-o",
        "${fileDirname}/${fileBasenameNoExtension}"
      ],
      "options": {
        "cwd": "${fileDirname}"
      },
      "problemMatcher": ["$gcc"],
      "group": {
        "kind": "build",
        "isDefault": true
      },
      "detail": "Task generated by the debugger."
    }
  ],
  "version": "2.0.0"
}Note: in args, ${file} after -g compiles only one file. How can we compile multiple C files?
Two options:
- Manage them with a Makefile. For Makefile syntax, see Chen Hao’s Writing Makefiles with Me.
- Replace the argument after -g with multiple C file paths, for example:
	"-g",
	"${workspaceFolder}/helloWorld.c",
	"${workspaceFolder}/struct_learn/book.c",
	"${workspaceFolder}/input_output_learn/read_user_input.c",
The documentation says wildcards such as *.c are supported. This works on Windows, but apparently not on macOS. A recent related GitHub issue is Update 1.19.4 breaks wildcard operator ’*’ in tasks.json code will not compile.
Generate launch.json
launch.json configures debugging.
- Following the documentation did not create launch.json automatically, so I created it manually.
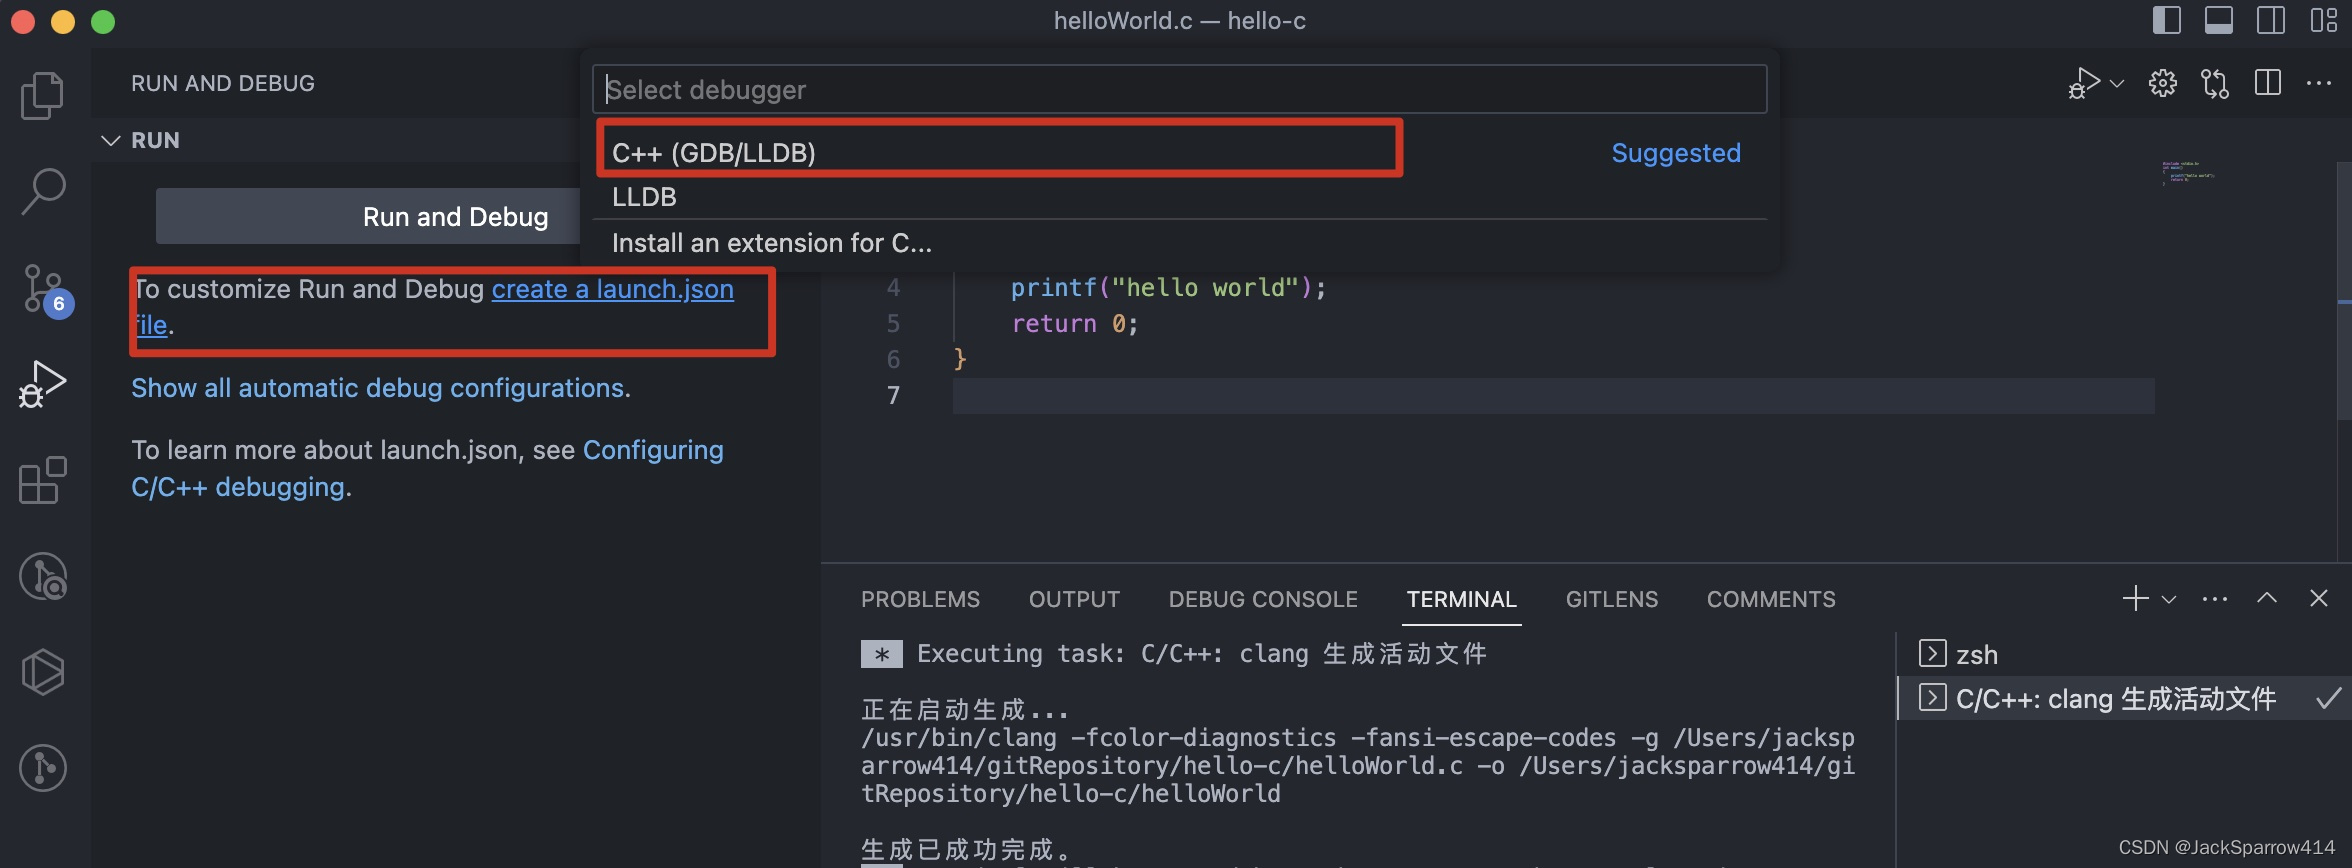 If C++ (GDB/LLDB) does not appear, open a C source file and click Debug C/C++ File on the right, then repeat the steps above. C++ (GDB/LLDB) should appear. Clicking it creates launch.json in .vscode, but the file contains no configuration, so add it manually. The following example modifies the official example.
{
  // Use IntelliSense to learn about possible attributes.
  // Hover to view descriptions of existing attributes.
  // For more information, visit: https://go.microsoft.com/fwlink/?linkid=830387
  // All attributes: https://code.visualstudio.com/docs/editor/debugging#_launchjson-attributes
  "version": "0.2.0",
  "configurations": [
    {
      "name": "C/C++: clang++ build and debug active file",
      "type": "cppdbg",
      "request": "launch",
      "program": "${fileDirname}/${fileBasenameNoExtension}",
      "args": [],
      "stopAtEntry": false,
      "cwd": "${workspaceFolder}",
      "environment": [],
      // Use an external terminal
      "externalConsole": true,
      "MIMode": "lldb",
      // Corresponds to the label in tasks.json
      "preLaunchTask": "C/C++: clang++ build active file"
    }
  ]
}
I will explain only the two commented points above:
- Enable an external terminal if debugging requires user input. Official documentation
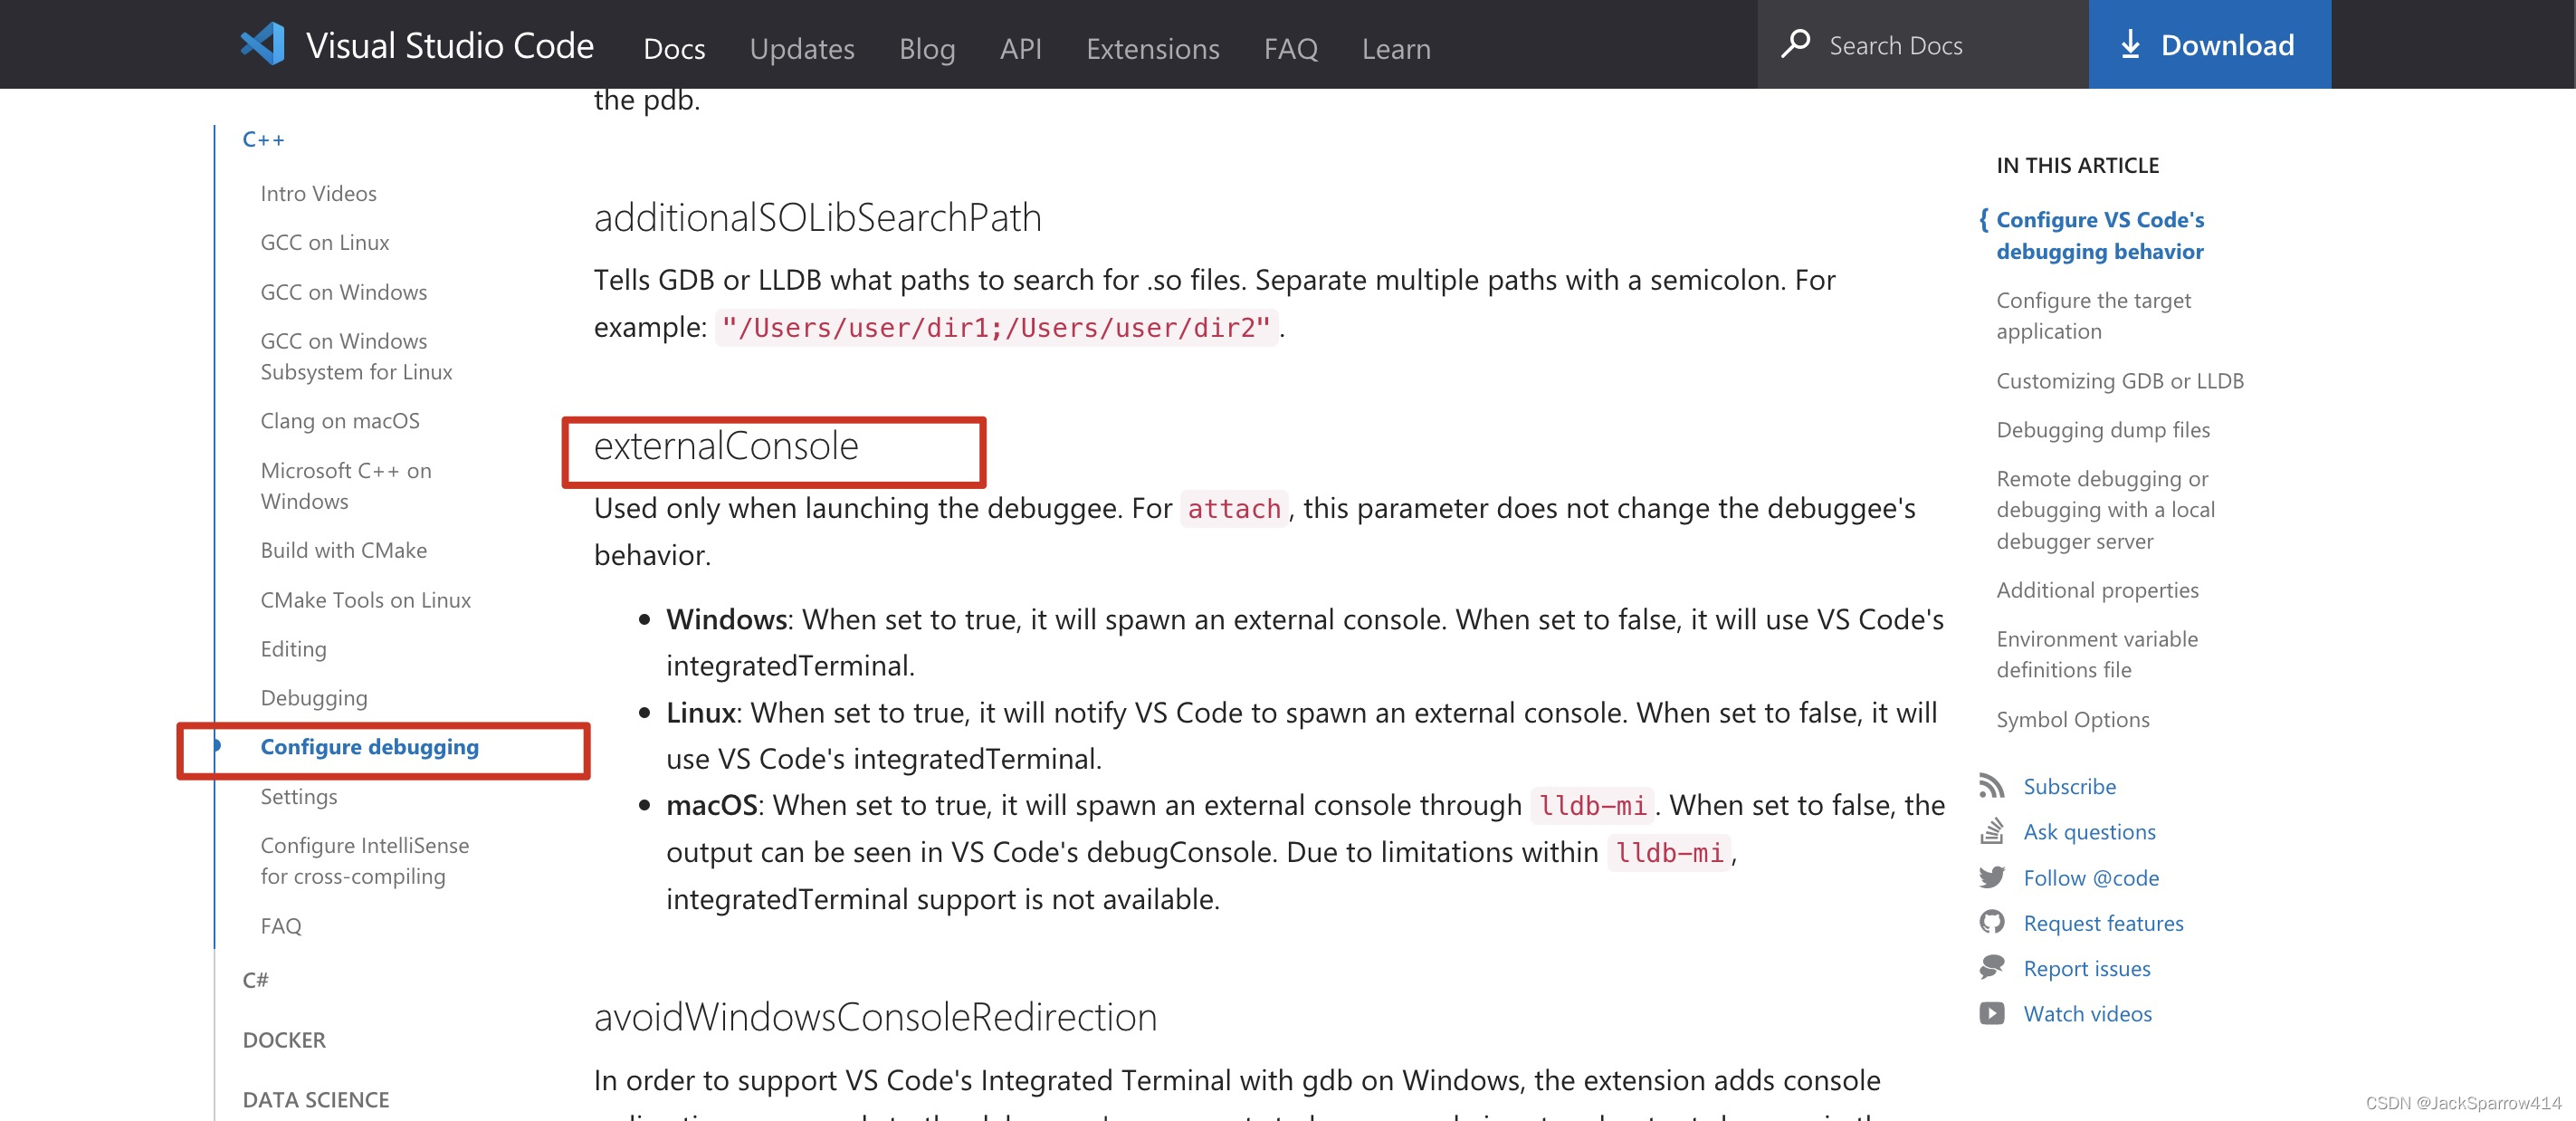
- Configure preLaunchTask to match the label in tasks.json. Compilation is needed before debugging, and task.json defines that task, so they must correspond.
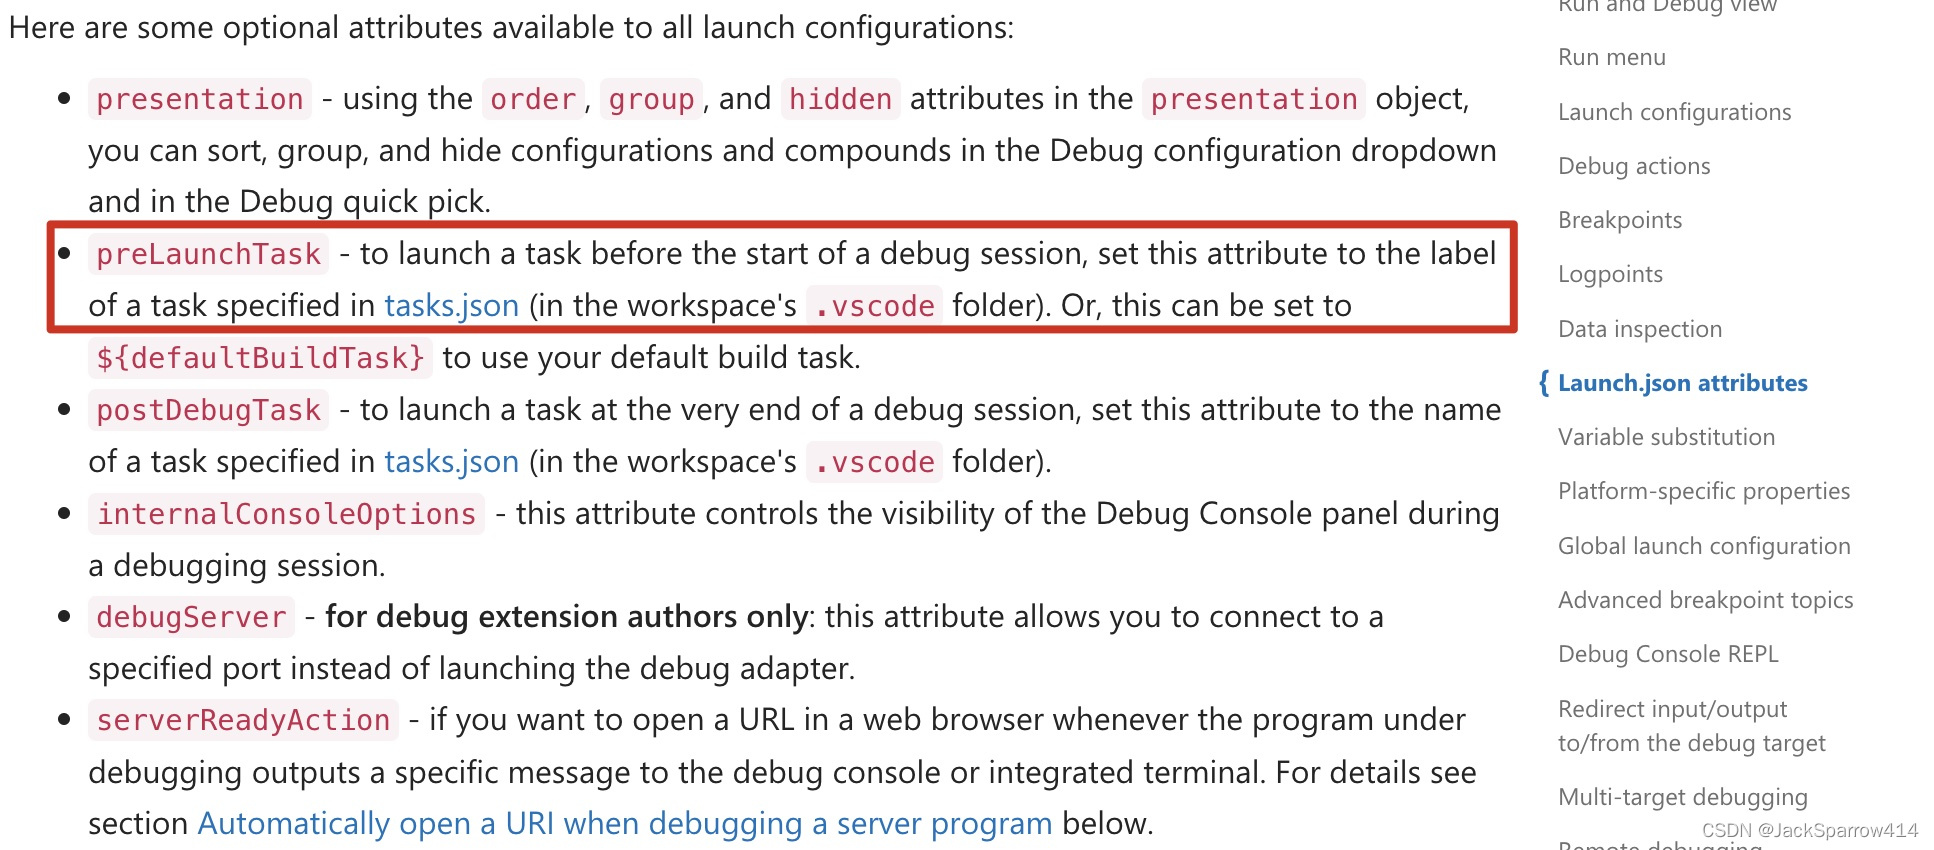 For details of all launch.json attributes, see User Guide > Debugging.
Test Debugging
Set breakpoints and start Debug mode from the C file containing main (F5 on Windows). On macOS, the built-in terminal opens, accepts input while debugging, and the program can be debugged normally.
How Can the Program Stay Open After Debugging?
Stack Overflow question: How to configure VS Code so it won’t close console after program run The answers I found online mostly suggested:
- Using pause.
- Adding a while(true) loop before termination.
Neither was what I wanted. Finally, I found a comment:
Place a breakpoint at the end of main
Haha, this is the simplest approach—just do this: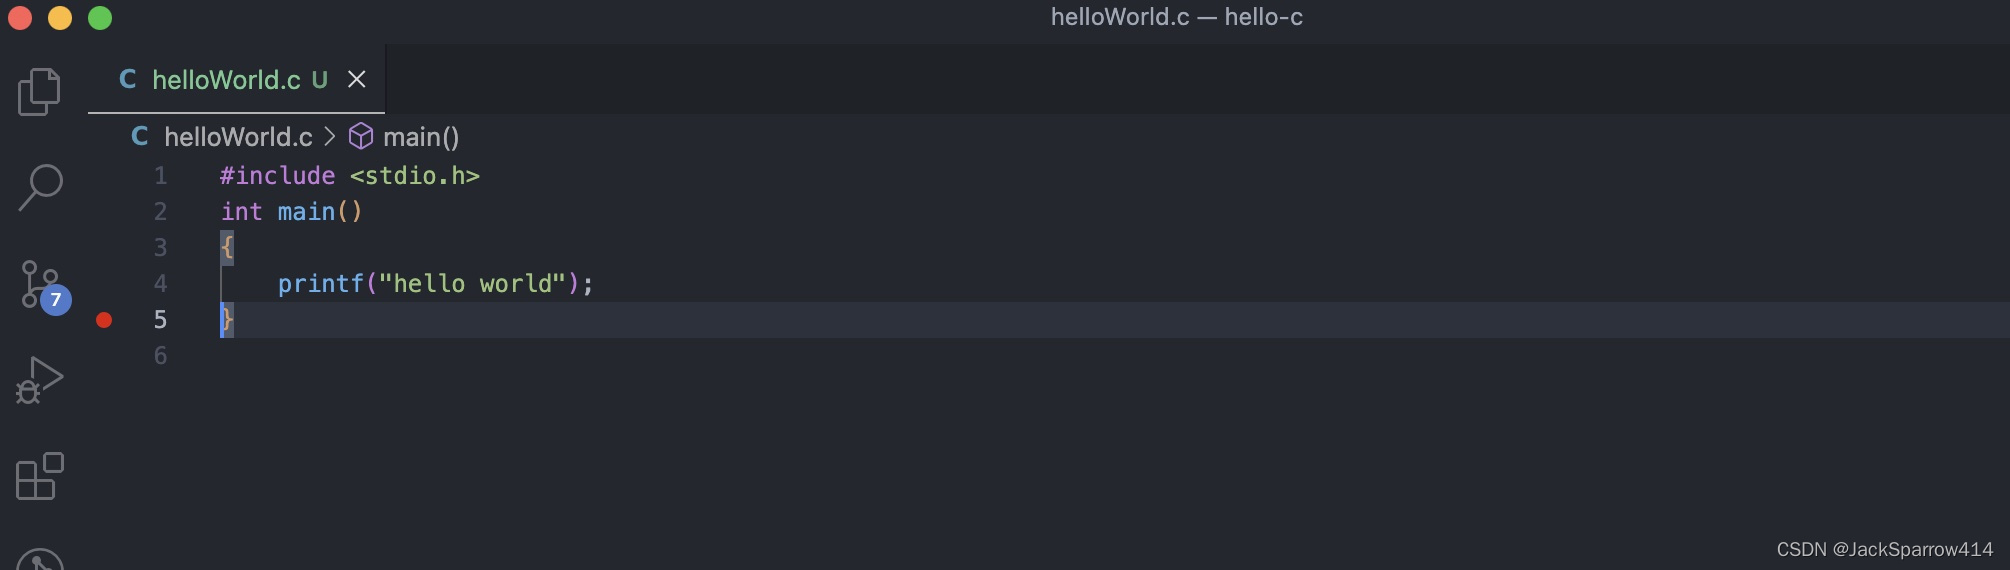 Place the breakpoint on the final }.
Windows Configuration
- On Windows, install MinGW first. See VS Code documentation > C++ > GCC on Windows > Installing the MinGW-w64 toolchain. Follow and verify each step.
gcc --version
g++ --version
gdb --version- My C/C++ extension configuration is shown here:
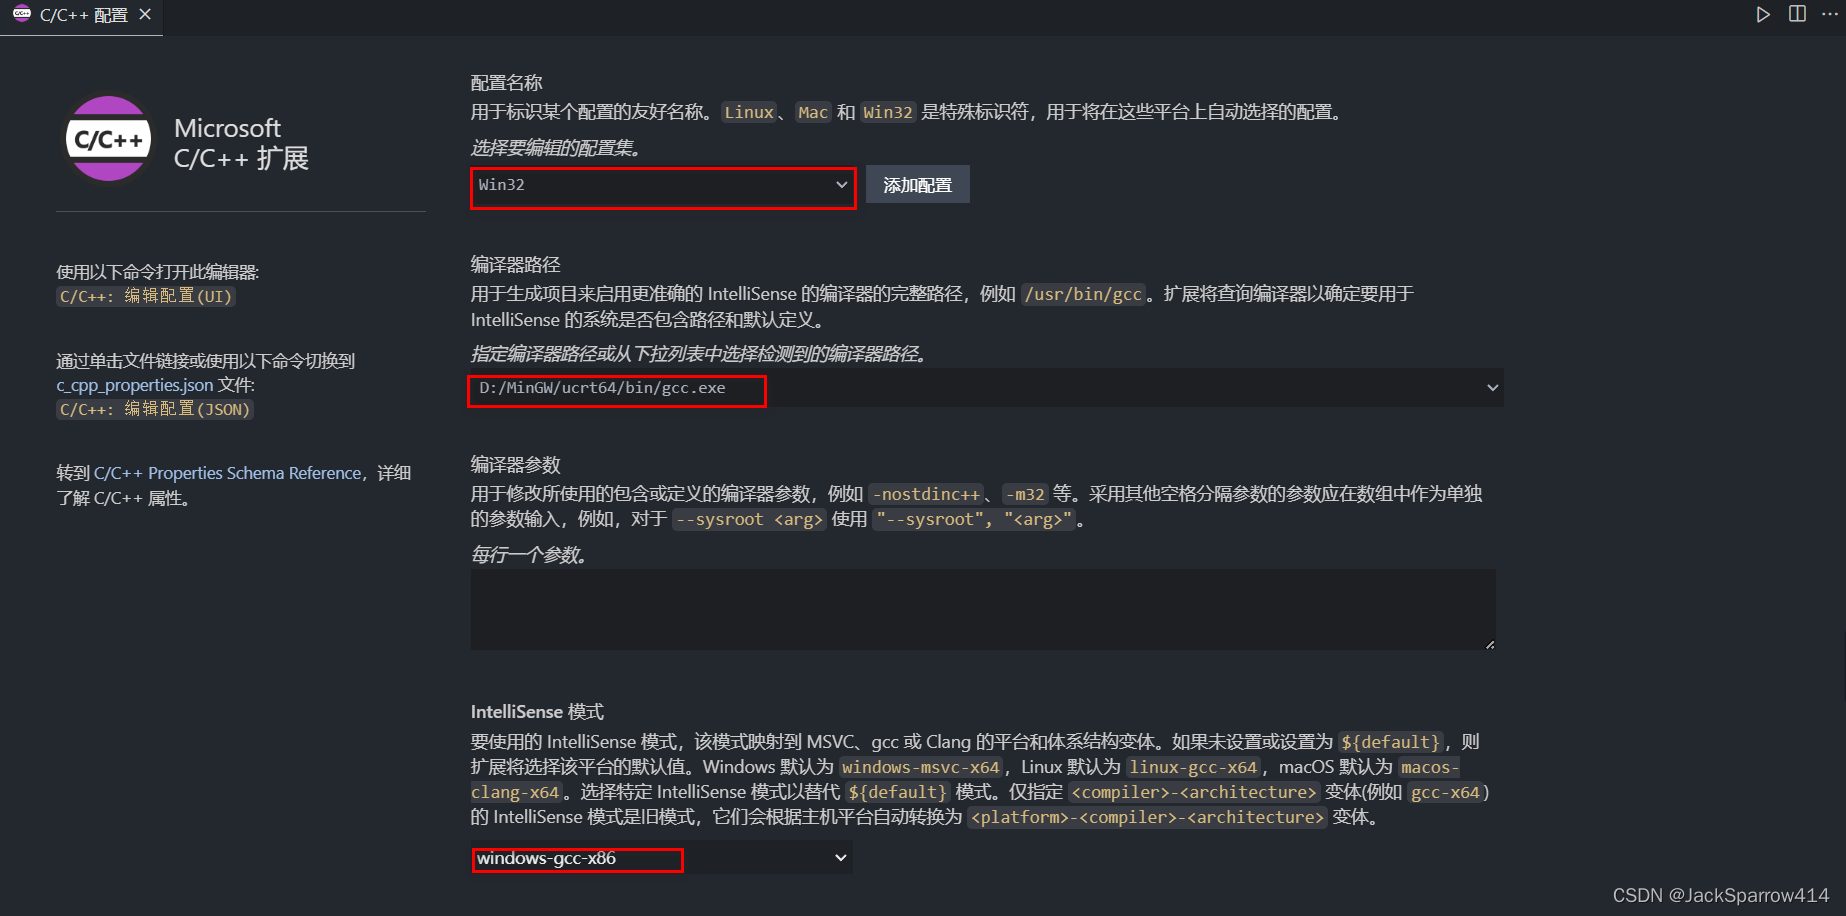
I modified this configuration; these are not the defaults.
{
  "configurations": [
    {
      "name": "Win32",
      "includePath": ["${workspaceFolder}/**"],
      "defines": ["_DEBUG", "UNICODE", "_UNICODE"],
      "windowsSdkVersion": "10.0.17763.0",
      "compilerPath": "D:/MinGW/ucrt64/bin/gcc.exe",
      "cppStandard": "c++17",
      "intelliSenseMode": "windows-gcc-x86"
    }
  ],
  "version": 4
}- tasks.json configuration:
{
  "tasks": [
    {
      "type": "cppbuild",
      "label": "C/C++: g++.exe build active file",
      "command": "D:\\MinGW\\ucrt64\\bin\\gcc.exe",
      "args": [
        "-fdiagnostics-color=always",
        "-g",
        "${file}",
        "-o",
        "${fileDirname}\\${fileBasenameNoExtension}.exe"
      ],
      "options": {
        "cwd": "${fileDirname}"
      },
      "problemMatcher": ["$gcc"],
      "group": {
        "kind": "build",
        "isDefault": true
      },
      "detail": "Task generated by the debugger."
    }
  ],
  "version": "2.0.0"
}- launch.json configuration:
{
  // Use IntelliSense to learn about possible attributes.
  // Hover to view descriptions of existing attributes.
  // For more information, visit: https://go.microsoft.com/fwlink/?linkid=830387
  "version": "0.2.0",
  "configurations": [
    {
      "name": "C Debug",
      "type": "cppdbg",
      "request": "launch",
      "program": "${fileDirname}\\${fileBasenameNoExtension}.exe",
      "args": [],
      "stopAtEntry": false,
      "cwd": "${workspaceFolder}",
      "environment": [],
      "externalConsole": true,
      // GDB mode
      "MIMode": "gdb",
      "miDebuggerPath": "D:\\MinGW\\ucrt64\\bin\\gdb.exe",
      "setupCommands": [
        {
          "description": "Enable pretty-printing for gdb",
          "text": "-enable-pretty-printing",
          "ignoreFailures": true
        }
      ],
      "preLaunchTask": "C/C++: g++.exe build active file"
    }
  ]
}
The Difference Between GDB and LLDB
- From a Stack Overflow answer: GDB Vs LLDB debuggers. In one sentence:
So, I would use LLDB while using Clang, use GDB while using GCC compiler as the good combination or pair because LLDB is based on LLVM, whereas GDB is the GNU debugger
Disassemble an Object File
Use objdump to disassemble a .o file:
objdump -d xxx.o